An initial path towards statistical analysis
Learning statistics takes time, as it is mostly experience that allows us to be able to approach the statistical analysis of any given dataset. While we cannot take off of you the burden to gather experience yourself, we developed this interactive page for you to find the best statistical method to analyze your given dataset. This can be a start for you to dive deeper into statistical analysis, and helps you better design studies.
This page revolves around statistical analyses of data that has at least two variables. If you only have one variable, e.g. height data of a dozen trees, or your ratings for five types of cake, you might be interested in simpler forms of data analysis and visualisation. Have a look at Descriptive statistics and Introduction to statistical figures to see which approaches might work for your data.
If you have more than one variable, you have come to the perfect place!
Go through the images step by step, click on the answers that apply to your data, and let the page guide you.
If you need help with data visualisation for any of these approaches, please refer to the entry on Introduction to statistical figures.
If you are on mobile and/or just want a list of all entries, please refer to the Statistics overview page.
Start here with your data! This is your first question.
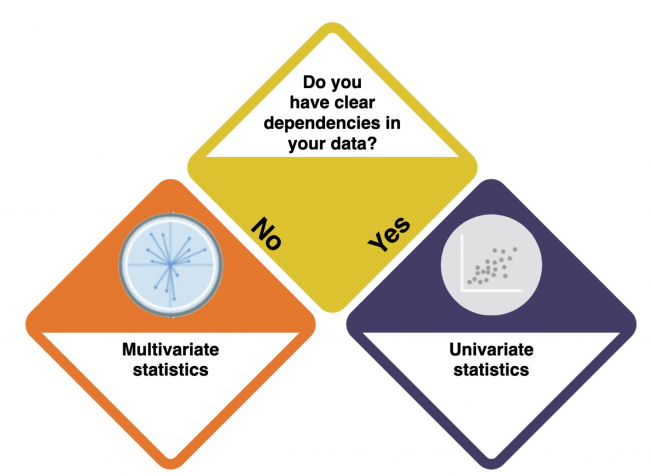

How do I know?
- What does the data show? Does the data logically suggest dependencies - a causal relation - between the variables? Have a look at the entry on Causality to learn more about causal relations and dependencies.
Contents
Univariate statistics
You are dealing with Univariate Statistics. Univariate statistics focuses on the analysis of one dependent variable and can contain multiple independent variables. But what kind of variables do you have?
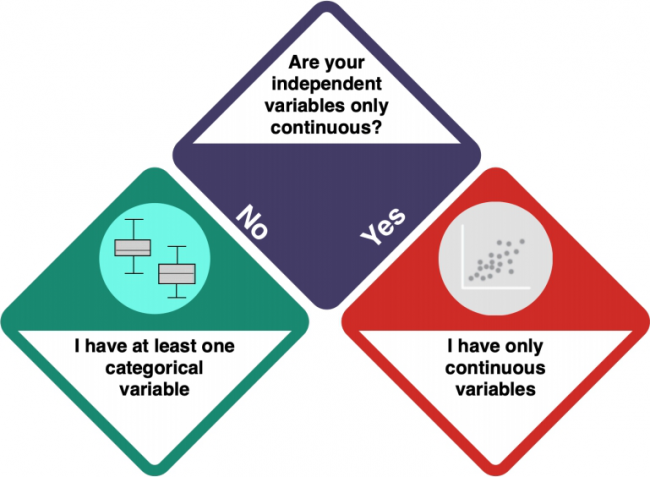

How do I know?
- Check the entry on Data formats to understand the difference between categorical and numeric (including continuous) variables.
- Investigate your data using
strorsummary. integer and numeric data is not categorical, while factorial, ordinal and character data is categorical.
At least one categorical variable
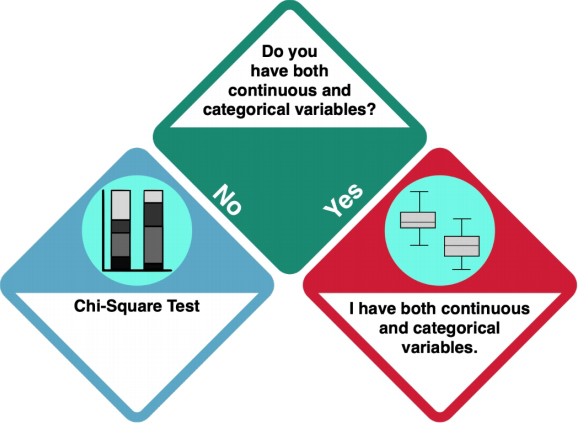
Your dataset does not only contain continuous data. Does it only consist of categorical data, or of categorical and continuous data?

How do I know?
- Investigate your data using
strorsummary. integer and numeric data is not categorical, while factorial, ordinal and character data is categorical.
Only categorical data: Chi Square Test
You should do a Chi Square Test.
A Chi Square test can be used to test if one variable influenced the other one, or if they occur independently from each other. The key R command here is: chisq.test(). Check the entry on Chi Square Tests to learn more.
Categorical and continuous data
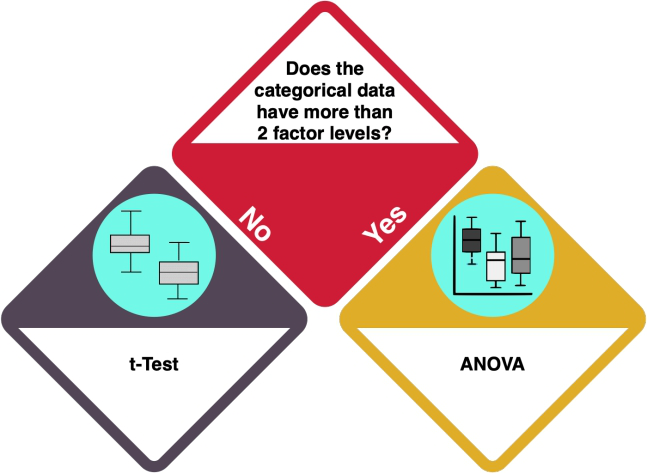
Your dataset consists of continuous and categorical data. How many levels does your categorical variable have?

How do I know?
- A 'factor level' is a category in a categorical variable. For example, when your variable is 'car brands', and you have 'AUDI' and 'TESLA', you have two unique factor levels.
- Investigate your data using 'levels(categoricaldata)' and count the number of levels it returns. How many different categories does your categorical variable have? If your data is not in the 'factor' format, you can either convert it or use 'unique(yourCategoricalData)' to get a similar result.
One or two factor levels: t-test
With one or two factor levels, you should do a t-test.
A one-sample t-test allows for a comparison of a dataset with a specified value. However, if you have two datasets, you should do a two-sample t-test, which allows for a comparison of two different datasets or samples and tells you if the means of the two datasets differ significantly. The key R command for both types is t.test(). Check the entry on the t-Test to learn more.
Depending on the variances of your variables, the type of t-test differs.
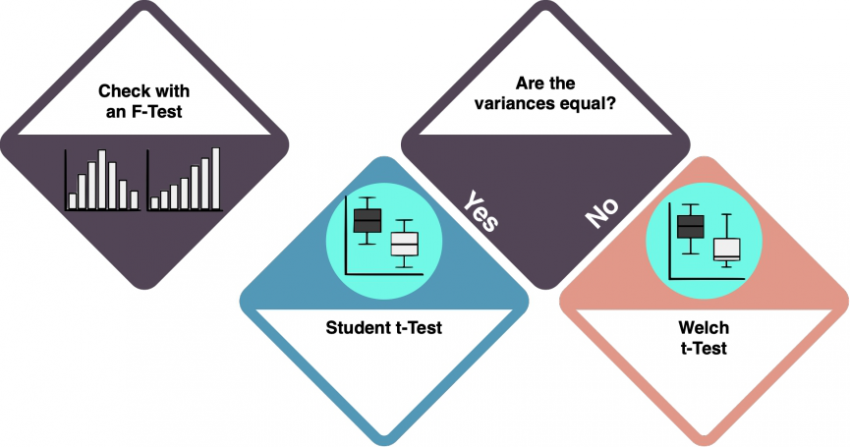

How do I know?
- Variance in the data is the measure of dispersion: how much the data spreads around the mean? Use an f-Test to check whether the variances of the two datasets are equal. The key R command for an f-test is
var.test(). If the rest returns insignificant results (>0.05), we can assume equal variances. Check the f-Test entry to learn more. - If the variances of your two datasets are equal, you can do a Student's t-test. By default, the function
t.test()in R assumes that variances differ, which would require a Welch t-test. To do a Student t-test instead, setvar.equal = TRUE.
More than two factor levels: ANOVA
Your categorical variable has more than two factor levels: you are heading towards an ANOVA.
However, you need to answer one more question: what about the distribution of your dependent variable?
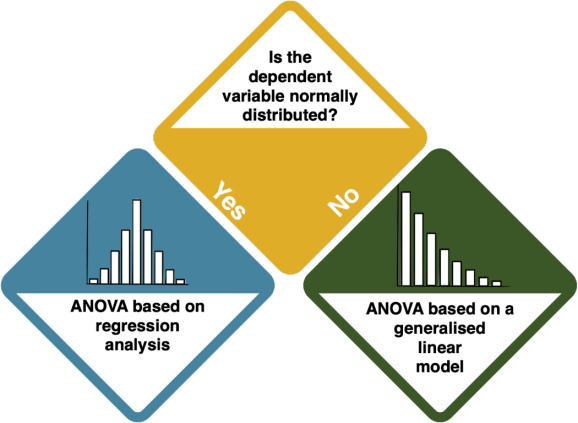

How do I know?
- Inspect the data by looking at histograms. The key R command for this is
hist(). Compare your distribution to the Normal Distribution. If the data sample size is big enough and the plots look quite symmetric, we can also assume it's normally distributed. - You can also conduct the Shapiro-Wilk test, which helps you assess whether you have a normal distribution. Use
shapiro.test(data$column)'. If it returns insignificant results (p-value > 0.05), your data is normally distributed.
Now, let us have another look at your variables. Do you have continuous and categorical independent variables?
How do I know?
- Investigate your data using
strorsummary. integer and numeric data is not categorical, while factorial, ordinal and character data is categorical.
If your answer is NO, you should stick to the ANOVA - more specifically, to the kind of ANOVA that you saw above (based on regression analysis, or based on a generalised linear model). An ANOVA compares the means of more than two groups by extending the restriction of the t-test. An ANOVA is typically visualised using Boxplots.
The key R command is aov(). Check the entry on the ANOVA to learn more.
If your answer is YES, you are heading way below. Click HERE.
Only continuous variables
So your data is only continuous.
Now, you need to check if there dependencies between the variables.
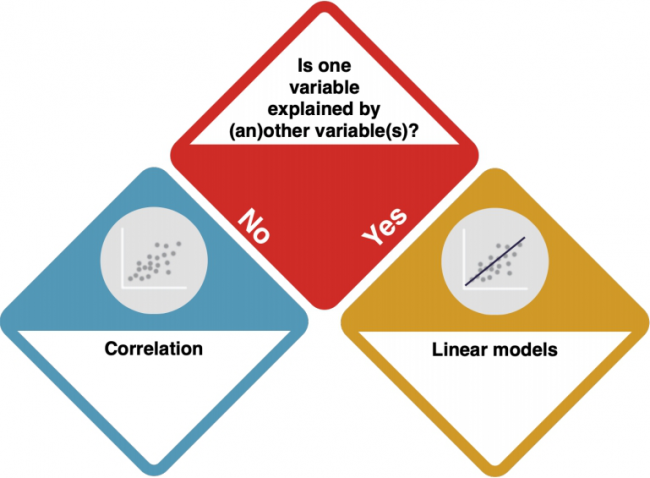

How do I know?
- Consider the data from a theoretical perspective. Is there a clear direction of the dependency? Does one variable cause the other? Check out the entry on Causality.
No dependencies: Correlations
If there are no dependencies between your variables, you should do a Correlation.
A correlation test inspects if two variables are related to each other. The direction of the connection (if or which variable influences another) is not set. Correlations are typically visualised using Scatter Plots or Line Charts. Key R commands are plot() to visualise your data, and cor.test() to check for correlations. Check the entry on Correlations to learn more.
The type of correlation that you need to do depends on your data distribution.
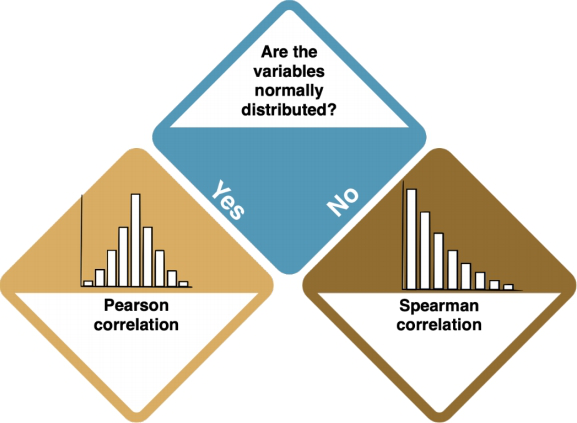

How do I know?
- Inspect the data by looking at histograms. The key R command for this is
hist(). Compare your distribution to the Normal Distribution. If the data sample size is big enough and the plots look quite symmetric, we can also assume it's normally distributed. - You can also conduct the Shapiro-Wilk test, which helps you assess whether you have a normal distribution. Use
shapiro.test(data$column)'. If it returns insignificant results (p-value > 0.05), your data is normally distributed.
Clear dependencies
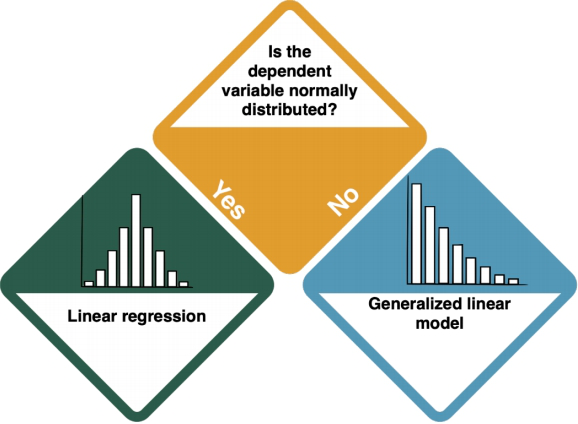
Your dependent variable is explained by one at least one independent variable. Is the dependent variable normally distributed?

How do I know?
- Inspect the data by looking at histograms. The key R command for this is
hist(). Compare your distribution to the Normal Distribution. If the data sample size is big enough and the plots look quite symmetric, we can also assume it's normally distributed. - You can also conduct the Shapiro-Wilk test, which helps you assess whether you have a normal distribution. Use
shapiro.test(data$column)'. If it returns insignificant results (p-value > 0.05), your data is normally distributed.
Normally distributed dependent variable: Linear Regression
If your dependent variable(s) is/are normally distributed, you should do a Linear Regression.
A linear regression is a linear approach to modelling the relationship between one (simple regression) or more (multiple regression) independent and a dependent variable. It is basically a correlation with causal connections between the correlated variables. Check the entry on Regression Analysis to learn more.
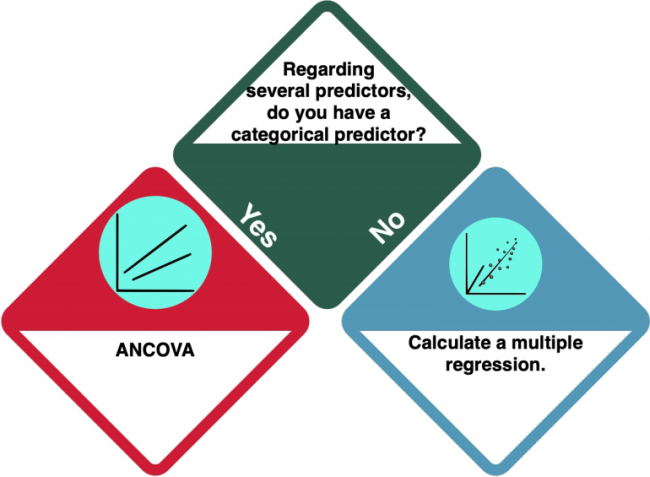
There may be one exception to a plain linear regression: if you have several predictors (= independent variables), there is one more decision to make:
Is there a categorical predictor?
You have several predictors (= independent variables) in your dataset. But is (at least) one of them categorical?

How do I know?
- Check the entry on Data formats to understand the difference between categorical and numeric variables.
- Investigate your data using
strorsummary. Pay attention to the data format of your independent variable(s). integer and numeric data is not categorical, while factorial, ordinal and character data is categorical.
ANCOVA
If you have at least one categorical predictor, you should do an ANCOVA. An ANCOVA is a statistical test that compares the means of more than two groups by taking under the control the "noise" caused by covariate variable that is not of experimental interest. Check the entry on Ancova to learn more.
Not normally distributed dependent variable
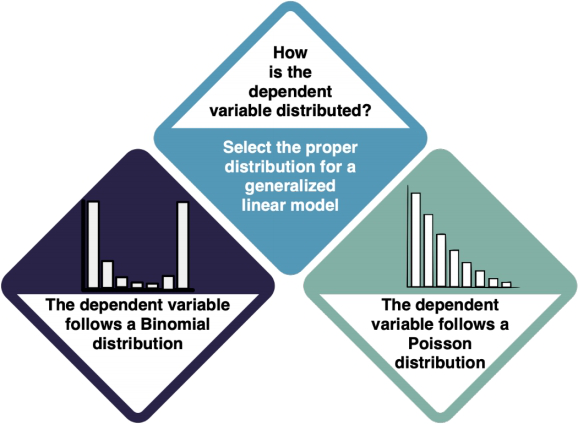
The dependent variable(s) is/are not normally distributed. Which kind of distribution does it show, then? For both Binomial and Poisson distributions, your next step is the Generalised Linear Model. However, it is important that you select the proper distribution type in the GLM.

How do I know?
- Try to understand the data type of your dependent variable and what it is measuring. For example, if your data is the answer to a yes/no (1/0) question, you should apply a GLM with a Binomial distribution. If it is count data (1, 2, 3, 4...), use a Poisson Distribution.
- Check the entry on Non-normal distributions to learn more.
Generalised Linear Models
You have arrived at a Generalised Linear Model (GLM). GLMs are a family of models that are a generalization of ordinary linear regressions. The key R command is glm().
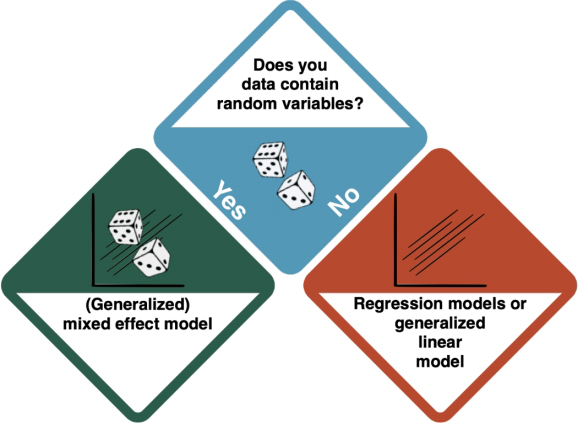
Depending on the existence of random variables, there is a distinction between Mixed Effect Models, and Generalised Linear Models based on regressions.

How do I know?
- Random variables introduce extra variability to the model. For example, we want to explain the grades of students with the amount of time they spent studying. The only randomness we should get here is the sampling error. But these students study in different universities, and they themselves have different abilities to learn. These elements infer the randomness we would not like to know, and can be good examples of a random variable. If your data shows effects that you cannot influence but which you want to "rule out", the answer to this question is 'yes'.
Multivariate statistics
You are dealing with Multivariate Statistics. Multivariate statistics focuses on the analysis of multiple variables at the same time.
Which kind of analysis do you want to conduct?
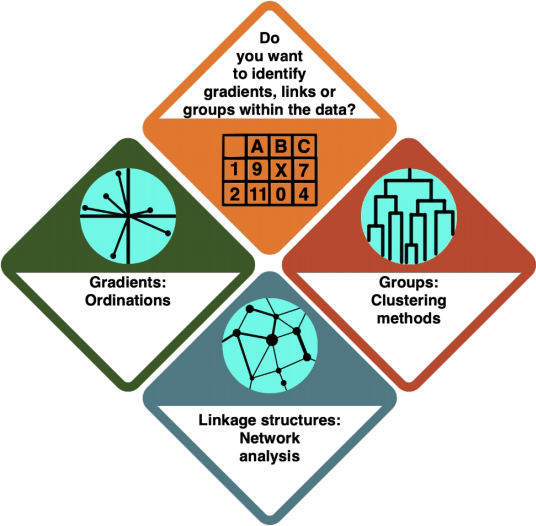

How do I know?
- In an Ordination, you arrange your data alongside underlying gradients in the variables to see which variables most strongly define the data points.
- In a Cluster Analysis (or general Classification), you group your data points according to how similar they are, resulting in a tree structure.
- In a Network Analysis, you arrange your data in a network structure to understand their connections and the distance between individual data points.
Ordinations
You are doing an ordination. In an Ordination, you arrange your data alongside underlying gradients in the variables to see which variables most strongly define the data points. Check the entry on Ordinations to learn more.
There is a difference between ordinations for different data types - for abundance data, you use Euclidean distances, and for continuous data, you use Jaccard distances.
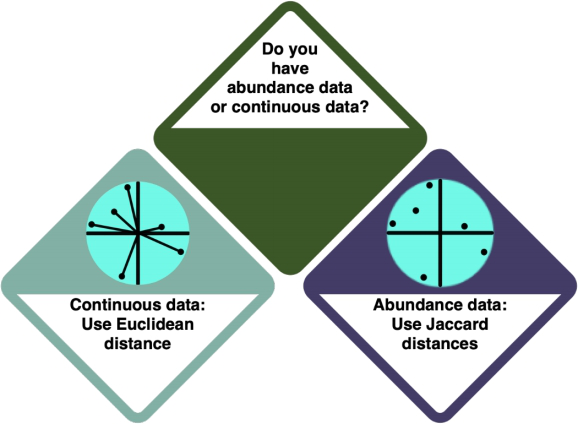

How do I know?
- Check the entry on Data formats to learn more about the different data formats. Abundance data is also referred to as 'discrete' data.
- Investigate your data using
strorsummary. Abundance data is referred to as 'integer' in R, i.e. it exists in full numbers, and continuous data is 'numeric' - it has a comma.
Cluster Analysis
So you decided for a Cluster Analysis - or Classification in general. In this approach, you group your data points according to how similar they are, resulting in a tree structure. Check the entry on Clustering Methods to learn more.
There is a difference to be made here, dependent on whether you want to classify the data based on prior knowledge (supervised, Classification) or not (unsupervised, Clustering).
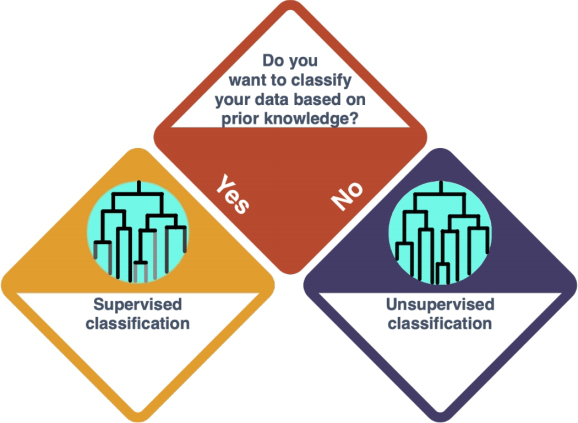

How do I know?
- Classification is performed when you have (X, y) pair of data (where X is a set of independent variables and y is the dependent variable). Hence, you can map each X to a y. Clustering is performed when you only have X in your dataset. So, this decision depends on the dataset that you have.
Network Analysis
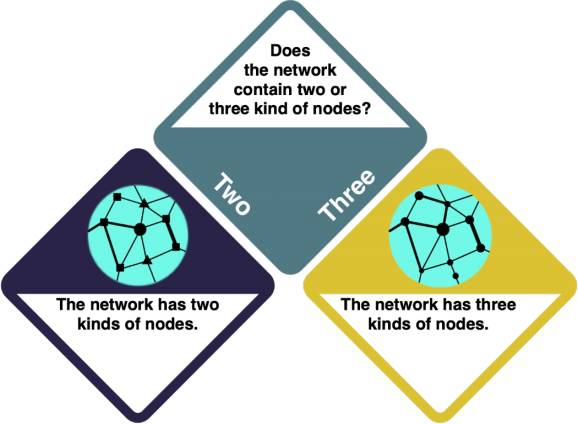
WORK IN PROGRESS You have decided to do a Network Analysis. In a Network Analysis, you arrange your data in a network structure to understand their connections and the distance between individual data points. Check the entry on Social Network Analysis and the R example entry to learn more. Keep in mind that network analysis is complex, and there is a wide range of possible approaches that you need to choose between.
How do I know what I want?
- Consider your research intent: are you more interested in the role of individual actors, or rather in the network structure as a whole?

Some general guidance on the use of statistics
While it is hard to boil statistics down into some very few important generalities, I try to give you here a final bucket list to consider when applying or reading statistics.
1) First of all, is the statistics the right approach to begin with? Statistics are quite established in science, and much information is available in a form that allows you to conduct statistics. However, will statistics be able to generate a piece of the puzzle you are looking at? Do you have an underlying theory that can be put into constructs that enable a statistical design? Or do you assume that a rather open research question can be approached through a broad inductive sampling? The publication landscape, experienced researchers as well as pre-test may shed light on the question whether statistics can contribute solving your problem.
2) What are the efforts you need to put into the initial data gathering? If you decided that statistics would be valuable to be applied, the question then would be, how? To rephrase this statement: How exactly? Your sampling with all its constructs, sample sizes and replicates decides about the fate of everything you going to do later. A flawed dataset or a small or biased sample will lead to failure, or even worse, wrong results. Play it safe in the beginning, do not try to overplay your hand. Slowly edge your way into the application of statistics, and always reflect with others about your sampling strategy.
3) The analysis then demands hand-on skills, as implementing tests within a software is something that you learn best through repetition and practice. I suggest you to team up with other peers who decide to go deeper into statistical analysis. If you however decide against that, try to find geeks that may help you with your data analysis. Modern research works in teams of complementary people, thus start to think in these dimensions. If you chip in the topical expertise of the effort to do the sampling, other people may be glad about the chance to analyse the data.
4) This is also true for the interpretation, which most of all builds on experience. This is the point were a supervisor or a PhD student may be able to glance at a result and tell you which points are relevant, and which are negotiable. Empirical research typically produces results where in my experience about 80 % are next to negliable. It takes time to learn the difference between a trivial and an innovative result. Building on knowledge of the literature helps again to this end, but be patient as the interpretation of statistics is a skill that needs to ripen, since context matters. It is not so much about the result itself, but more about the whole context it is embedded in.
5) The last and most important point explores this thought further. What are the limitations of your results? Where can you see flaws, and how does the multiverse of biases influence your results and interpretation? What are steps to be taken in future research? And what would we change if we could start over and do the whole thing again? All these questions are like ghosts that repeatedly come to haunt a researcher, which is why we need to remember we look at pieces of the puzzle. Acknowledging this is I think very important, as much of the negative connotation statistics often attracts is rooted in a lack of understanding. If people would have the privilege to learn about statistics, they could learn about the power of statistics, as wells its limitations.
Never before did more people in the world have the chance to study statistics. While of course statistics can only offer a part of the puzzle, I would still dare to say that this is reason for hope. If more people can learn to unlock this knowledge, we might be able to move out of ignorance and more towards knowledge. I think it would be very helpful if in a controversial debate everybody could dig deep into the available information, and make up their own mind, without other people telling them what to believe. Learning about statistics is like learning about anything else, it is lifelong learning. I believe that true masters never achieve mastership, instead they never stop to thrive for it.
The authors of this entry are Henrik von Wehrden (concept, text) and Christopher Franz (implementation, linkages).