An initial path towards statistical analysis
Start here with your data! This is your first question.
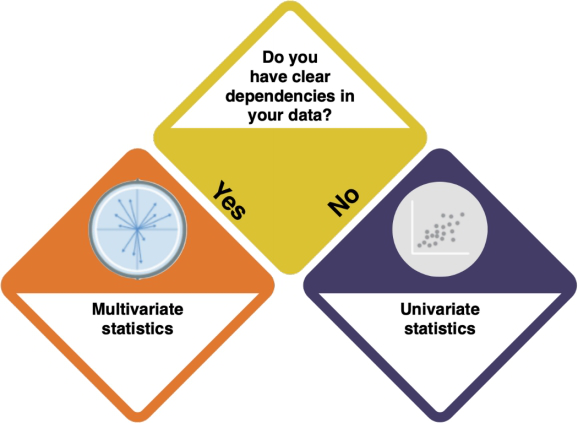

How do I know?
- Inspect your data with
strorsummary. Are there several variables? - What does the data show? Does the underlying logic of the data suggest dependencies between the variables?
Example: Inspecting the swiss dataset
Contents
Univariate statistics
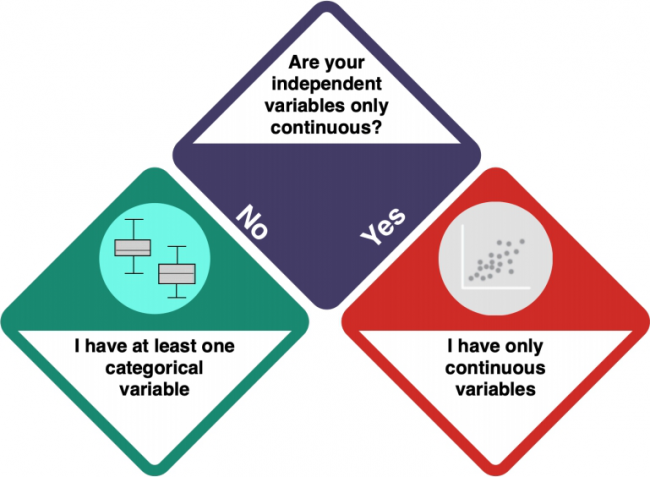

How do I know?
- Check the entry on Data formats to understand the difference between categorical and numeric variables.
- Investigate your data using
strorsummary. integer and numeric data is not categorical, while factorial and character data is.
At least one categorical variable

How do I know?
- Investigate your data using
strorsummary. integer and numeric data is not categorical, while factorial and character data is.
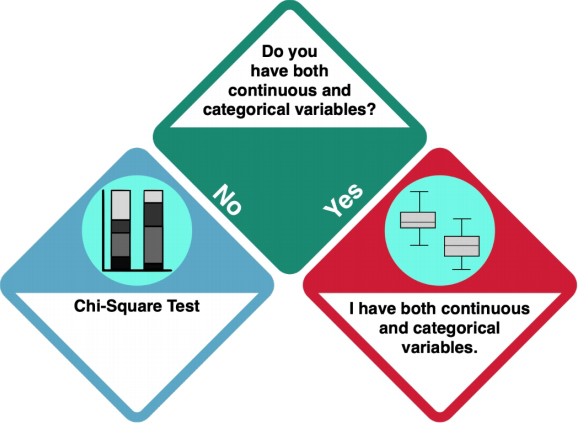
Only categorical data: Chi Square Test
If you have only categorical variables, you should do a Chi Square Test. LINK TO CHI SQUARE TEST R EXAMPLE
Categorical and continuous data

How do I know?
- R commands: quantile(), str, summary
- Investigate your categorical dependent variables using...
- ADD MORE
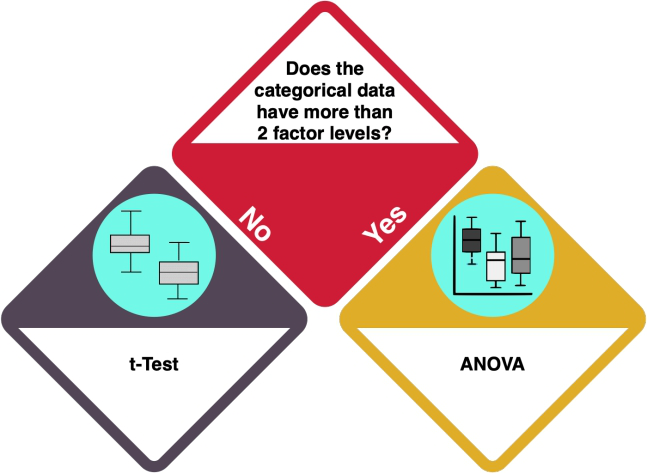
One or two factor levels
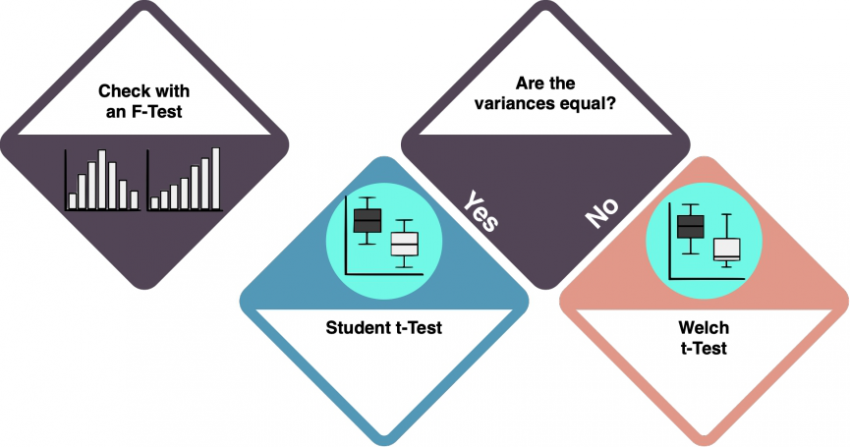

How do I know?
- Use an F-Test to check whether the variances of the datasets are equal. LINK LEFT BOX TO F-TEST
t-test
No matter the variances, you arrive at a t-test. A t-test ADD. Check the entry on the T-Test to learn more. ADAPT THE T-TEST ENTRY SO THAT DIFFERENCE BETWEEN STUDENT AND WELCH IS CLEAR
More than two factor levels
MISSING - COMPLICATED FIGURE
Analysis of Variance
R commands: aov, Anova, ezAnova, var.test(), lm
Relevant figures: boxplot()
Is your dependent variable normally distributed?
R commands: ks.test, shapiro.test, hist
Yes, my dependent variable is normally distributed!
No, my dependent variable is binomial distributed!
No, my dependent variable is Poisson distributed!
Gaussian Anova
R commands: aov, lm
Relevant figures: boxplot
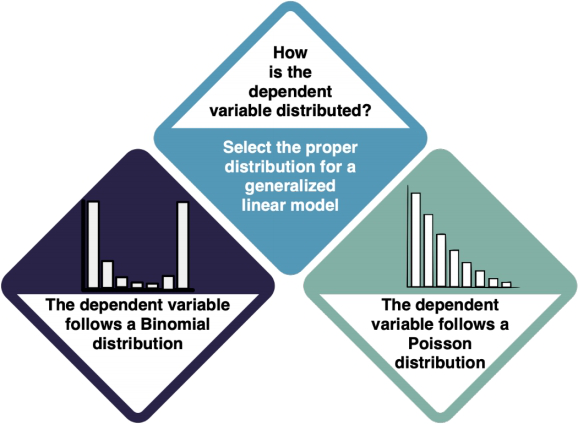
Is your dependent variable binomial or Poisson
Poisson GLM|Dependent variable is count data
R commands: glm,
Relevant figures: plot
Binomial GLM|Dependent variable is 0/1 or proportion
R commands:
Relevant figures:
Type III Anova
R commands: Anova(car)
Relevant figures: boxplot
Data_distribution#Non-normal_distributions|Dependent variable not normally distributed]
Poisson GLM|Dependent variable is count data
R commands: glm
Relevant figures: plot
Binomial GLM|Dependent variable is 0/1 or proportions]
R commands: glm
Relevant figures:
Only continuous variables
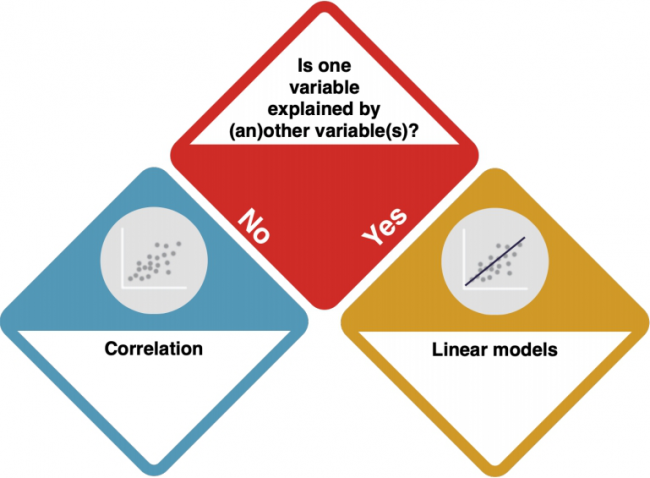

How do I know?
- ADD INFO - HOW DO I KNOW IF THEY ARE DEPENDENT?
No dependencies

LINK TO CORRELATION R EXAMPLES INSTEAD? How do I know?
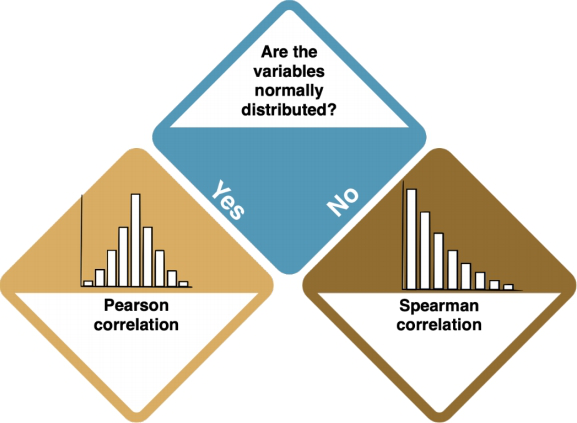
- ADD INFO - HOW DO I KNOW IF THE DATA IS NORMALLY DISTRIBUTED?
- Check the entry on Normal distributions to learn more.
Correlation
You are dealing with a Correlation. A correlation ...
- ADD INFO ON PEARSON AND SPEARMAN CORRELATIONS; WITH R CODE
- Check the entry on Correlations to learn more.
Clear dependencies

How do I know?
- ADD INFO - HOW DO I KNOW IF THE DATA IS NORMALLY DISTRIBUTED?
- Check the entry on Normal distributions to learn more.
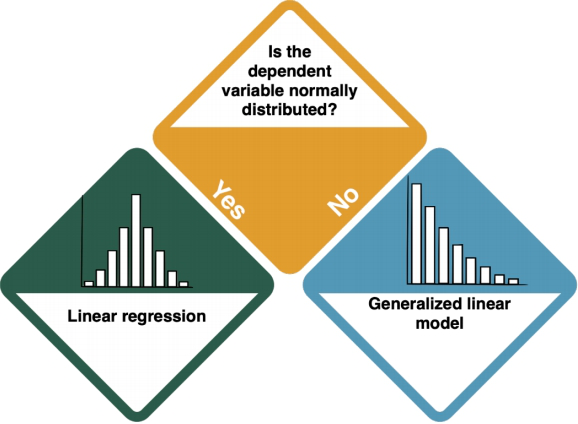
Linear Regression
Non-linear distribution of dependent variable

How do I know?
- ADD INFO - HOW DO I KNOW THE DISTRIBUTION TYPE?
- Check the entry on Non-normal distributions to learn more.
- For both types of distribution, your next step is the Generalised Linear Model. However, it is important that you select the proper distribution type in the GLM ADD MORE INFO
Generalised Linear Models
Generalised Linear Models are... ADD
Depending on the existence of random variables, there is a distinction between Mixed Effect Models and Generalised Linear Models based on regressions.
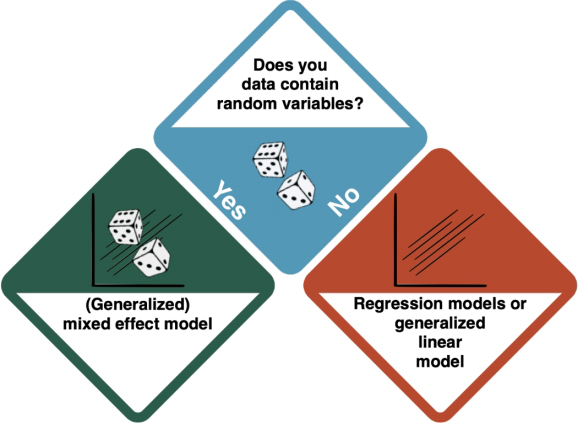

How do I know?
- HOW DO I KNOW IF I HAVE RANDOM VARIABLES???
- R commands: glmer, glmmPQL
Relevant figures:
WHAT IS THIS ABOUT?
Dependent variable is count data
Dependent variable is 0/1 or proportions
Multivariate statistics
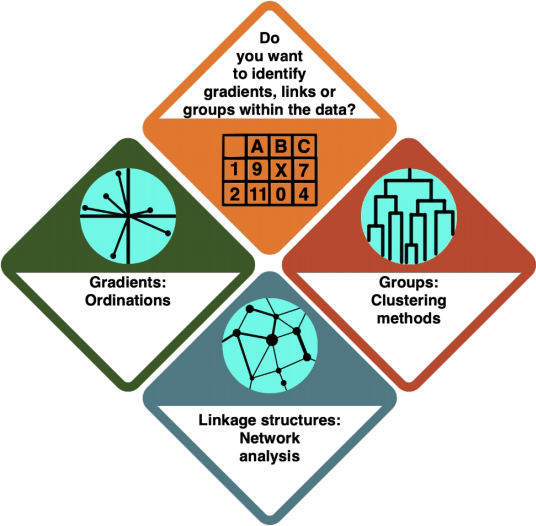

How do I know?
- In an Ordination, you arrange your data alongside underlying gradients in the variables to see which variables most strongly define the data points. Check the entry on Ordinations (to be added) to learn more.
- In a Cluster Analysis, you group your data points according to how similar they are, resulting in a tree structure. Check the entry on Clustering Methods to learn more.
- In a Network Analysis, you arrange your data in a network structure to understand their connections and the distance between individual data points. Check the entry on Social Network Analysis to learn more.
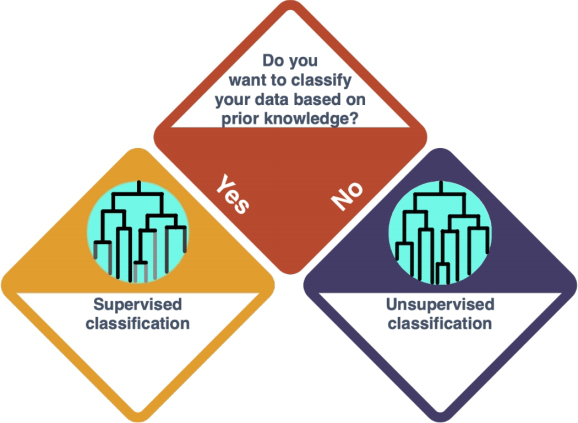
Cluster analysis
DIFFERENCE BETWEEN SUPERVISED AND UNSUPERVISED?? DISTINCTION NOT MADE IN THE CLUSTERING ENTRY

How do I know?
TAKE OUT LINK TO CLUSTERING METHODS ENTRY???
Supervised classification
R commands:
Relevant figures:
Unsupervised classification
R commands:
Relevant figures:
Network analysis
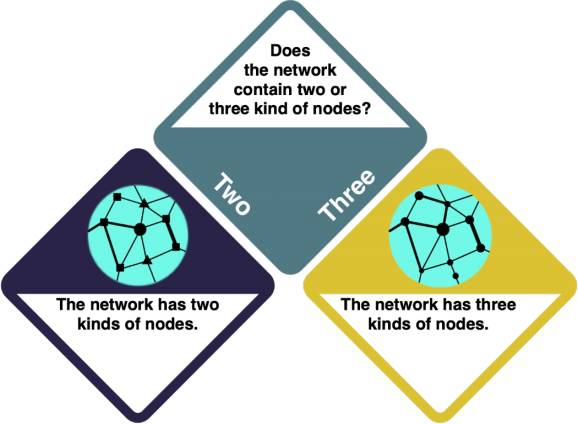

How do I know?
- Check your data using the R code ADD CODE
ADD MORE BELOW
Bipartite
If your data has two different kinds of nodes, your network is called a "bipartite" network.
R commands:
- is_bipartite(graph)
- make_bipartite_graph(types, edges, directed = FALSE)
Tripartite
R commands:
Relevant figures:
Ordinations
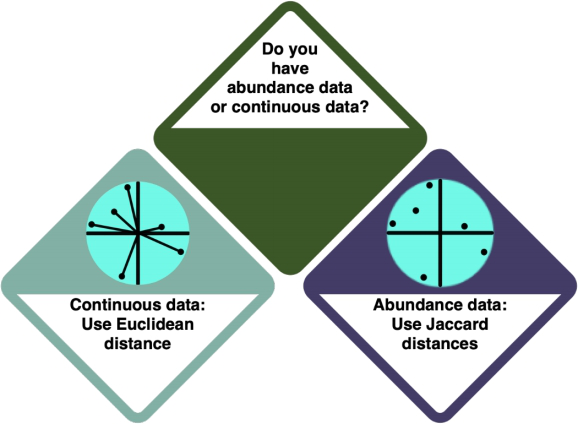

How do I know?
- Check the entry on Data formats to learn more about the different data formats.
- Investigate your data using
strorsummary. Abundance data is marked as FORMATNAME, and continuous data is marked as FORMATNAME.
MAKE THE STUFF BELOW CLEARER
Linear-based ordinations
Linear-based ordinations are... It uses Euclidean distances, which is...
R commands:
Relevant figures:
Correspondance analysis
A correspondence analysis is... It uses Jaccard distances, which is...
R commands:
Relevant figures:
Is your dependent variable normally distributed?
Is your dependent variable not normally distributed?
Does your independent variable contain only 1 or 2 groups?
Does your independent variable contain more than 2 groups?
Is your dependent variable normally distributed?
Is your dependent variable not normally distributed?
Resterampe
Analysis of Variance
INSERT TYPE II
INSERT RANDOM FACTOR
INSERT LMM
Dependent variable is count data
Dependent variable is 0/1 or proportions