An initial path towards statistical analysis
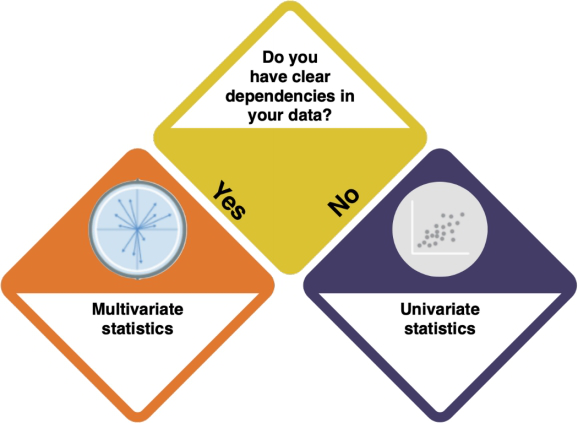
Start here with your data! This is your first question.

How do I know?
- Inspect your data with
strorsummary. Are there several variables? - What does the data show? Does the underlying logic of the data suggest dependencies between the variables?

Do you have several continuous variables without clear dependencies? (?)
Yes, I have several continuous variables without clear dependencies!
No, my variables have clear dependencies!
R commands: str, summary, head, tail
Example: Inspecting the swiss dataset
Contents
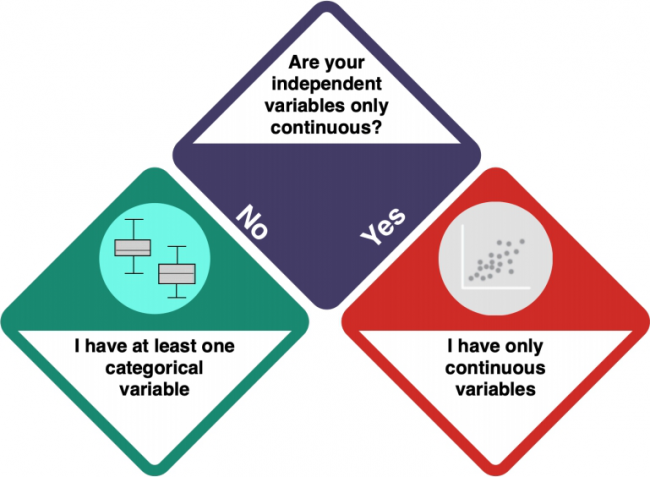
Univariate statistics

How do I know?
- Check the entry on Data formats to understand the difference between categorical and numeric variables.
- Tip: integer and numeric data is not categorical, while factorial and character data is.
Does you data contain at least one categorical variable?
Yes, my data contains at least one categorical variable?
No, my data contains only continuous variables?
No, my variables have clear dependencies!
R commands: str, summary, head, tail, ordered(dataset$variablename, c(levels = “level1”, level2”...))
Relevant figures: hist(), boxplot()
Categorical variables
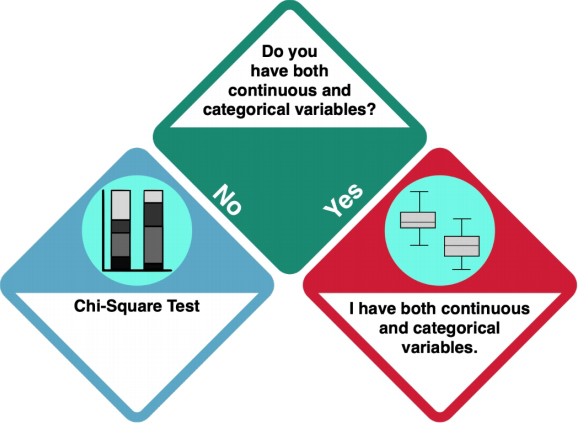

Does you data contain only categorical variables?
Yes, my data contain only categorical variables?
No, my data does contains continuous and categorical variables?
Chi-Square test
R commands: table, chisq.test( x, correct=TRUE)
Relevant figures: (stacked) bar charts : barplot(), pie(), bipartite
Categorical and continuous data
R commands: quantile(), str, summary,
Does you categorical dependent variables have 1-2 factor levels?
Yes, my categorical dependent variables has 1-2 factor levels!
No, my categorical dependent variables more than 2 factor levels!
t-test
R commands: t.test, t_test Relevant figures:
Analysis of Variance
R commands: aov, Anova, ezAnova, var.test(), lm
Relevant figures: boxplot()
Is your dependent variable normally distributed?
R commands: ks.test, shapiro.test, hist
Yes, my dependent variable is normally distributed!
No, my dependent variable is binomial distributed!
No, my dependent variable is Poisson distributed!
Gaussian Anova
R commands: aov, lm
Relevant figures: boxplot
Is your dependent variable binomial or Poisson
Dependent variable is count data
R commands: glm,
Relevant figures: plot
Dependent variable is 0/1 or proportions
R commands:
Relevant figures:
Type III Anova
R commands: Anova(car)
Relevant figures: boxplot
Dependent variable not normally distributed
Dependent variable is count data
R commands: glm
Relevant figures: plot
Dependent variable is 0/1 or proportions
R commands: glm
Relevant figures:
Are there random factor variables?
Random factors
R commands: glmer, glmmPQL
Relevant figures:
Continuous variables
Non dependent relations?
Correlations
Clear dependent relations
Regression models
Dependent variable normally distributed
Linear Regression
Dependent variable not normally distributed
Generalised linear model
Dependent variable is count data
Dependent variable is 0/1 or proportions
R commands:
Relevant figures:
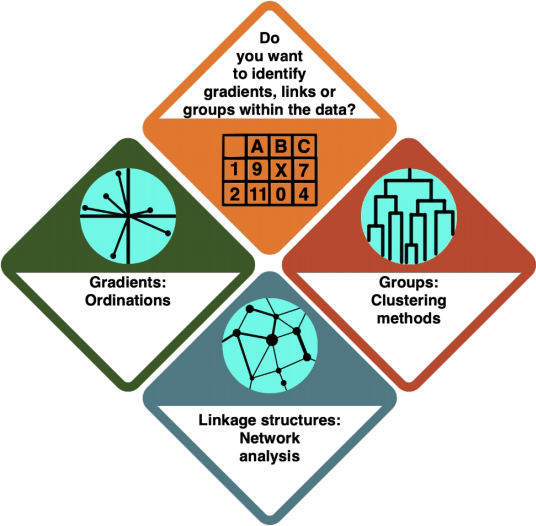
Multivariate statistics

R commands:
Relevant figures:
Data is classified into groups
R commands:
Relevant figures:
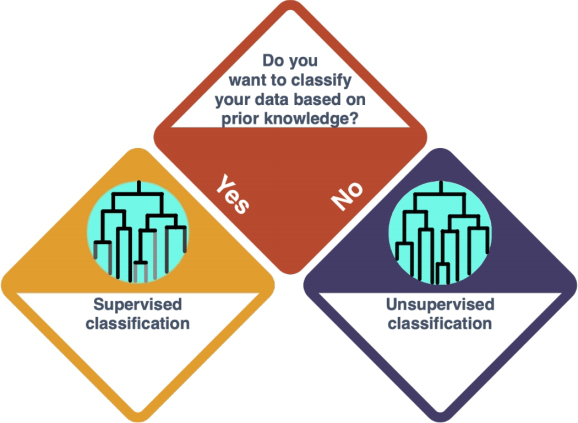
Cluster analysis
DIFFERENCE BETWEEN SUPERVISED AND UNSUPERVISED?? DISTINCTION NOT MADE IN THE CLUSTERING ENTRY

R commands:
Relevant figures:
Supervised classification
R commands:
Relevant figures:
Unsupervised classification
R commands:
Relevant figures:
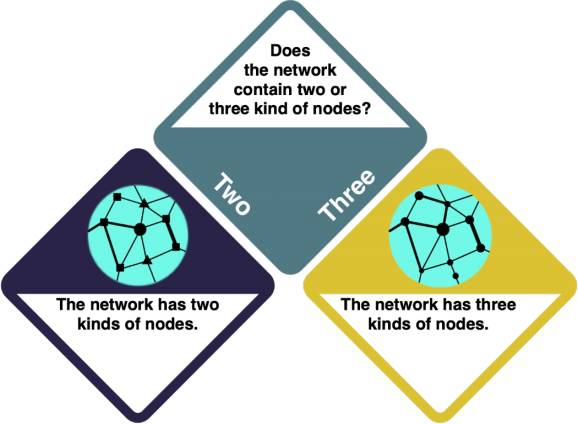
Network analysis

R commands:
Relevant figures:
Bipartite
R commands: is_bipartite(graph)
Relevant figures: make_bipartite_graph(types, edges, directed = FALSE)
Tripartite
R commands:
Relevant figures:
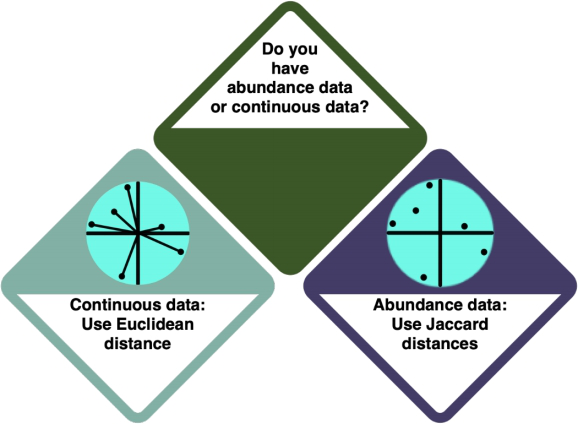
Ordinations

R commands:
Relevant figures:
Linear based ordinations
R commands:
Relevant figures:
Correspondance analysis
R commands:
Relevant figures:
Is your dependent variable normally distributed?
Is your dependent variable not normally distributed?
Does your independent variable contain only 1 or 2 groups?
Does your independent variable contain more than 2 groups?
Is your dependent variable normally distributed?
Is your dependent variable not normally distributed?
Resterampe
[[At least one continuous and one categorical variable|
More than 2 groups
Analysis of Variance
Dependent variable normally distributed
INSERT TYPE II
INSERT RANDOM FACTOR
INSERT LMM
Dependent variable not normally distributed
Dependent variable is count data
Dependent variable is 0/1 or proportions