Difference between revisions of "An initial path towards statistical analysis"
| Line 41: | Line 41: | ||
A Chi Square test is... ADD SHORT DESCRIPTION. | A Chi Square test is... ADD SHORT DESCRIPTION. | ||
LINK TO CHI SQUARE TEST R EXAMPLE (does not yet exist) | LINK TO CHI SQUARE TEST R EXAMPLE (does not yet exist) | ||
| + | |||
=== Categorical and continuous data === | === Categorical and continuous data === | ||
| Line 71: | Line 72: | ||
'''How do I know?''' | '''How do I know?''' | ||
* Use an F-Test to check whether the variances of the datasets are equal. LINK LEFT BOX TO F-TEST ENTRY (does not yet exist) | * Use an F-Test to check whether the variances of the datasets are equal. LINK LEFT BOX TO F-TEST ENTRY (does not yet exist) | ||
| + | |||
==== More than two factor levels: ANOVA ==== | ==== More than two factor levels: ANOVA ==== | ||
| Line 94: | Line 96: | ||
<br/><br/> | <br/><br/> | ||
SOMEHOW LINK TO ANCOVA HERE | SOMEHOW LINK TO ANCOVA HERE | ||
| + | |||
== Only continuous variables == | == Only continuous variables == | ||
| Line 119: | Line 122: | ||
'''How do I know?''' | '''How do I know?''' | ||
| − | * Inspect the data by looking at histograms. Compare them to the Normal Distribution. | + | * Inspect the data by looking at histograms. Compare them to the Normal Distribution. WHAT IS THE R CODE FOR THIS? |
| − | * Perform a statistical test like the Shapiro-Wilk test. | + | * Perform a statistical test like the Shapiro-Wilk test. WHAT IS THE R CODE FOR THIS? |
* Check the entry on [[Data_distribution#The_normal_distribution|Normal distributions]] to learn more. | * Check the entry on [[Data_distribution#The_normal_distribution|Normal distributions]] to learn more. | ||
| Line 133: | Line 136: | ||
'''How do I know?''' | '''How do I know?''' | ||
| − | * Inspect the data by looking at histograms. Compare them to the Normal Distribution. | + | * Inspect the data by looking at histograms. Compare them to the Normal Distribution. WHAT IS THE R CODE FOR THIS? |
| − | * Perform a statistical test like the Shapiro-Wilk test. | + | * Perform a statistical test like the Shapiro-Wilk test. WHAT IS THE R CODE FOR THIS? |
* Check the entry on [[Data_distribution#The_normal_distribution|Normal distributions]] to learn more. | * Check the entry on [[Data_distribution#The_normal_distribution|Normal distributions]] to learn more. | ||
| Line 172: | Line 175: | ||
'''How do I know?''' | '''How do I know?''' | ||
| − | * Try to understand the data type of your dependent variable and what it is measuring | + | * Try to understand the data type of your dependent variable and what it is measuring. For example, if your data is the answer to a yes/no (1/0) question, you should use a Binomial distribution. If it is count data (1, 2, 3, 4...), use a Poisson Distribution. DO WE 'USE' THE DISTRIBUTION; OR DOES THE DATA ALREADY HAVE IT AND WE JUST LET THE GLM KNOW THAT? - WORDING NOT QUITE CLEAR HERE |
* Check the entry on [[Data_distribution#Non-normal_distributions|Non-normal distributions]] to learn more. | * Check the entry on [[Data_distribution#Non-normal_distributions|Non-normal distributions]] to learn more. | ||
| Line 187: | Line 190: | ||
'''How do I know?''' | '''How do I know?''' | ||
| − | * Are there any variables that you cannot influence but whose effects you want to "rule out"? | + | * Are there any variables that you cannot influence but whose effects you want to "rule out"? IF SO: WHAT DO WE CHOOSE THEN? |
MAKE SURE THAT THE GLM ENTRY AND THE MIXED EFFECT MODEL ENTRY EXPLAIN THE ROLE OF RANDOM VARIABLES; AND POSSIBLY ALSO EXPLAIN THE ROLE OF DIFFERENT DISTRIBUTIONS (BINOMIAL; POISSON) | MAKE SURE THAT THE GLM ENTRY AND THE MIXED EFFECT MODEL ENTRY EXPLAIN THE ROLE OF RANDOM VARIABLES; AND POSSIBLY ALSO EXPLAIN THE ROLE OF DIFFERENT DISTRIBUTIONS (BINOMIAL; POISSON) | ||
Revision as of 07:34, 24 March 2021
This interactive page allows you to find the best statistical method to analyze your given dataset.
Go through the images step by step, click on the answers that apply to your data, and let the page guide you.
Start here with your data! This is your first question.
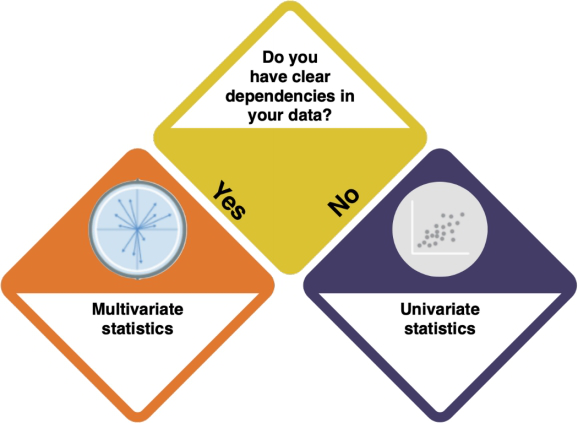

How do I know?
- Inspect your data with
strorsummary. Are there several variables? An example for this can be found here: Inspecting the swiss dataset - What does the data show? Do the data suggest dependencies between the variables?
Contents
Univariate statistics
You are dealing with Univariate Statistics. This means that... ADD
You either have only one variable, or the variables are dependent on each other (CORRECT?). But what kind of variables do you have?
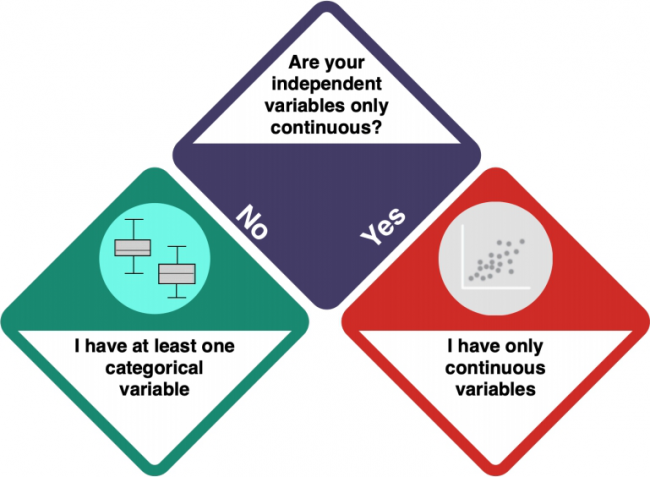

How do I know?
- Check the entry on Data formats to understand the difference between categorical and numeric variables.
- Investigate your data using
strorsummary. integer and numeric data is not categorical, while factorial and character data is.
At least one categorical variable
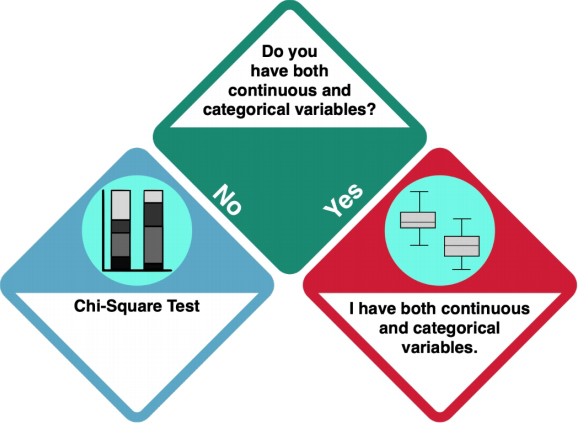
Your dataset does not only contain continuous data. Is it only categorical, though?

How do I know?
- Investigate your data using
strorsummary. integer and numeric data is not categorical, while factorial and character data is.
Only categorical data: Chi Square Test
If you have only categorical variables, you should do a Chi Square Test.
A Chi Square test is... ADD SHORT DESCRIPTION.
LINK TO CHI SQUARE TEST R EXAMPLE (does not yet exist)
Categorical and continuous data
Your dataset is a mix of categorical and continuous variables. How many factor levels ADD BETTER EXPLANATION

How do I know?
- R commands: quantile(), str, summary
- Investigate your categorical dependent variables using...
- ADD MORE
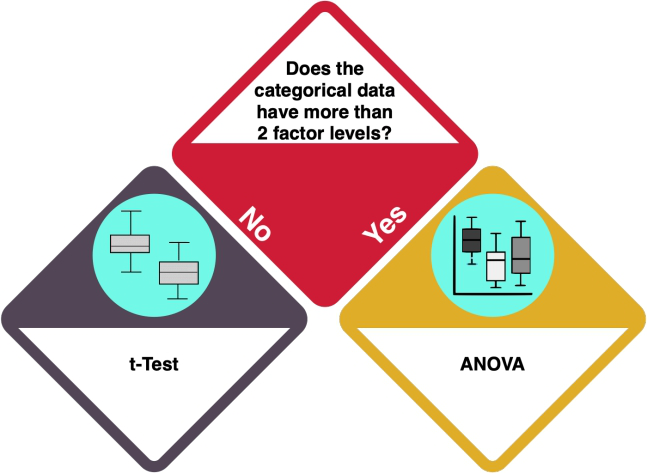
One or two factor levels: t-test
With one or two factor levels, you should do a t-test.
A t-test is ... ADD INFO.
Check the entry on the T-Test to learn more.
Depending on the variances of your variables, the type of t-test differs.
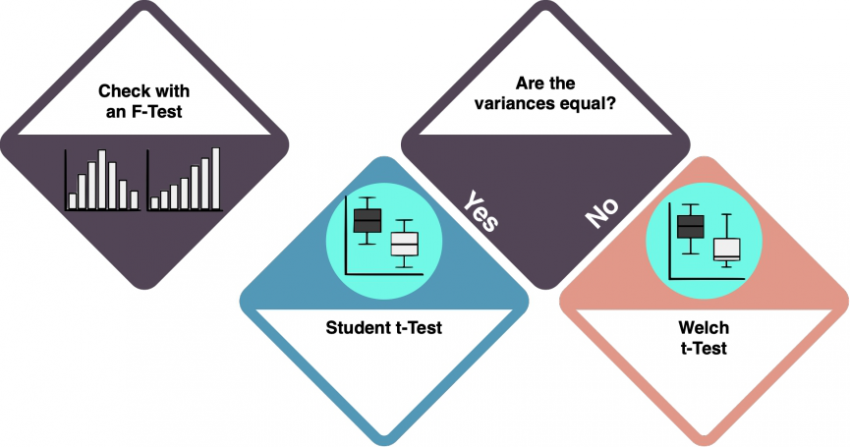

ADAPT THE T-TEST ENTRY SO THAT DIFFERENCE BETWEEN STUDENT AND WELCH IS CLEAR
How do I know?
- Use an F-Test to check whether the variances of the datasets are equal. LINK LEFT BOX TO F-TEST ENTRY (does not yet exist)
More than two factor levels: ANOVA
Your categorical variable has more than two factor levels: you should do an ANOVA.
An ANOVA is... ADD.
Check the entry on the ANOVA to learn more. (CHANGE THIS LINK WHEN THERE IS A DEDICATED ANOVA ENTRY)
However, the kind of ANOVA that you should do depends on the distribution of your dependent variable.
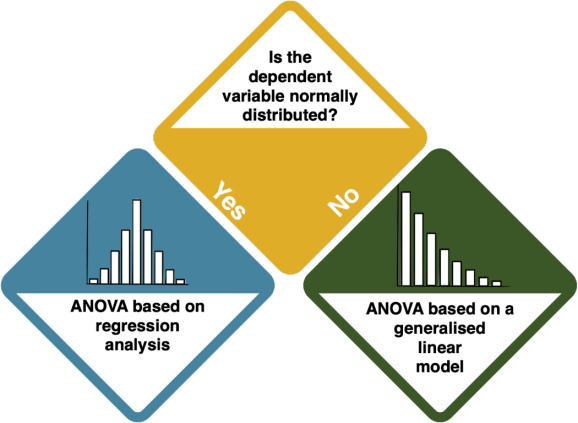

How do I know?
- R commands: ks.test, shapiro.test, hist ADD - HOW DO I TEST A NORMAL DISTRIBUTION HERE?
- Check the entry on Normal distributions to learn more.
THE IMAGE NEEDS TO LINK TO A PAGE WHERE BOTH TYPES OF ANOVA ARE EXPLAINED (R EXAMPLES)
You might end here, but you might also want to do a Multiple ANOVA with model reduction.
WHEN AND WHY??
WHERE DO WE LINK IF PEOPLE WANT TO DO A MULTIPLE ANOVA?
SOMEHOW LINK TO ANCOVA HERE
Only continuous variables
Your data is only continuous. Are there dependencies between the variables?
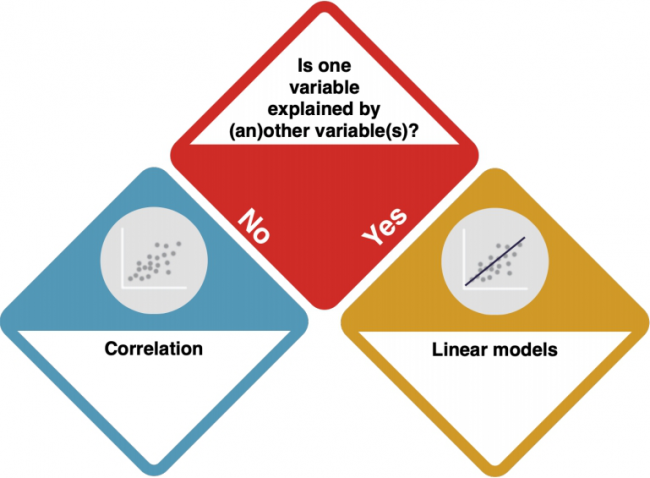

How do I know? Consider the data from a theoretical perspective. Is there a clear direction of the dependency? Does one variable cause the other? Check out the entry on Causality.
No dependencies: Correlations
If there are no dependencies between your variables, you should do a Correlation.
A correlation test inspects if two variables are related to each other. The direction of the connection (if or which variable influences another) is not set.
Check the entry on Correlations to learn more.
The type of correlation that you need to do depends on your data distribution.
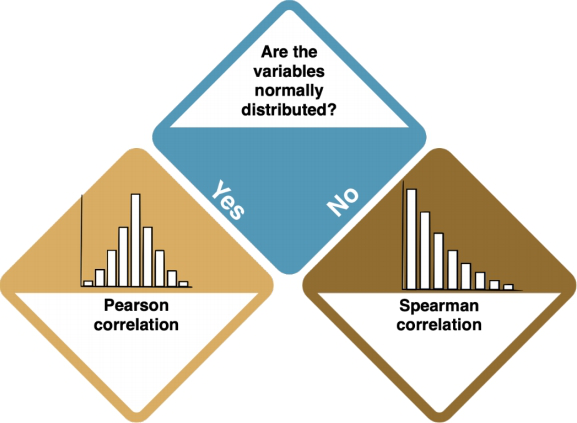

How do I know?
- Inspect the data by looking at histograms. Compare them to the Normal Distribution. WHAT IS THE R CODE FOR THIS?
- Perform a statistical test like the Shapiro-Wilk test. WHAT IS THE R CODE FOR THIS?
- Check the entry on Normal distributions to learn more.
LINK BOTH BOXES TO R EXAMPLE PAGES ON PEARSON AND SPEARMAN CORRELATIONS
Clear dependencies
You have one (or more) dependent variable(s) in your dataset EXPLAIN BETTER. Is the dependent variable normally distributed?
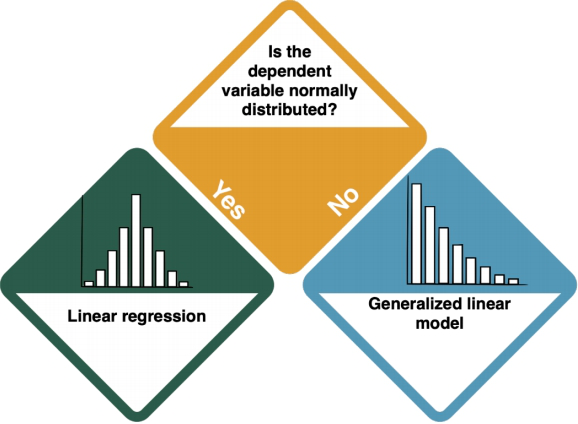

How do I know?
- Inspect the data by looking at histograms. Compare them to the Normal Distribution. WHAT IS THE R CODE FOR THIS?
- Perform a statistical test like the Shapiro-Wilk test. WHAT IS THE R CODE FOR THIS?
- Check the entry on Normal distributions to learn more.
Normally distributed dependent variable: Linear Regression
If your dependent variable(s) is/are normally distributed, you should do a Linear Regression.
A linear regression is.. ADD
Check the entry on Linear Regressions (does not yet exist) to learn more.
There may be one exception to a plain linear regression: if you have several predictors, there is one more decision to make:
Is there a categorical predictor?
You have several predictors in your dataset. WHAT DOES THIS MEAN? But is (at least) one of them categorical?
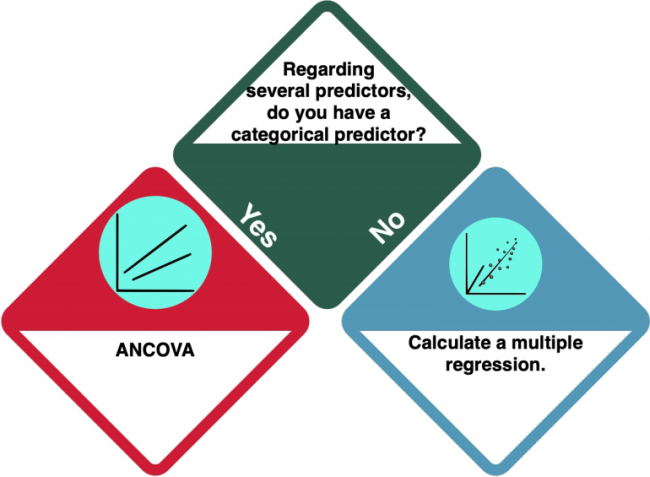

How do I know?
- Check the entry on Data formats to understand the difference between categorical and numeric variables.
- Investigate your data using
strorsummary. integer and numeric data is not categorical, while factorial and character data is. - HOW ELSE DO I KNOW IF THERE IS A CATEGORICAL PREDICTOR?
ANCOVA
If you have at least one categorical predictor, you should do an ANCOVA. An ANCOVA is.... (ADD) Check the entry on ANCOVA to learn more.
Not normally distributed dependent variable
The dependent variable(s) is/are not normally distributed. Which kind of distribution does it show, then? For both Binomial and Poisson distributions, your next step is the Generalised Linear Model. However, it is important that you select the proper distribution type in the GLM.
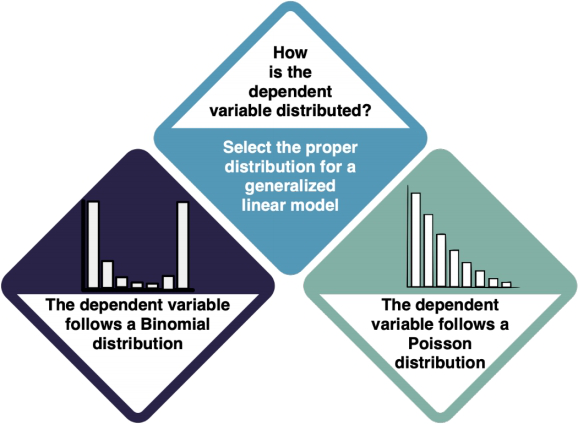

How do I know?
- Try to understand the data type of your dependent variable and what it is measuring. For example, if your data is the answer to a yes/no (1/0) question, you should use a Binomial distribution. If it is count data (1, 2, 3, 4...), use a Poisson Distribution. DO WE 'USE' THE DISTRIBUTION; OR DOES THE DATA ALREADY HAVE IT AND WE JUST LET THE GLM KNOW THAT? - WORDING NOT QUITE CLEAR HERE
- Check the entry on Non-normal distributions to learn more.
Generalised Linear Models
You have arrived at a Generalised Linear Model (GLM). GLMs are... ADD
Depending on the existence of random variables, there is a distinction between Mixed Effect Models, and Generalised Linear Models, which are based on regressions.
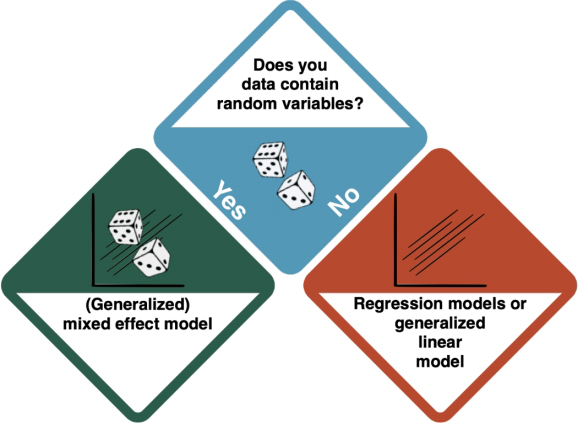

How do I know?
- Are there any variables that you cannot influence but whose effects you want to "rule out"? IF SO: WHAT DO WE CHOOSE THEN?
MAKE SURE THAT THE GLM ENTRY AND THE MIXED EFFECT MODEL ENTRY EXPLAIN THE ROLE OF RANDOM VARIABLES; AND POSSIBLY ALSO EXPLAIN THE ROLE OF DIFFERENT DISTRIBUTIONS (BINOMIAL; POISSON)
Multivariate statistics
You are dealing with Multivariate Statistics. This means that ... ADD You have multiple variables, and maybe they also have internal dependencies (CORRECT?). Which kind of analysis do you want to conduct?
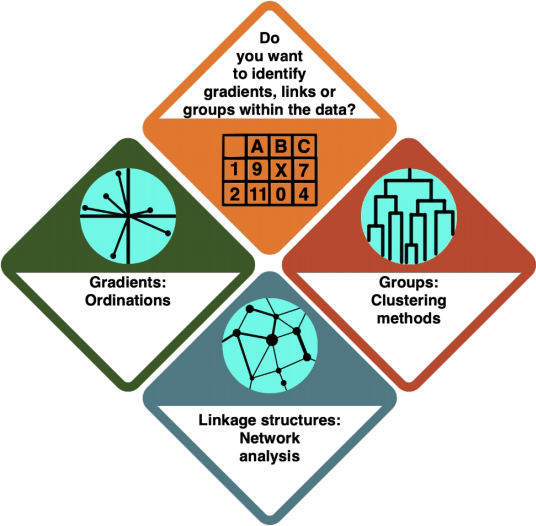

How do I know? (ARE THE DESCRIPTIONS OK?)
- In an Ordination, you arrange your data alongside underlying gradients in the variables to see which variables most strongly define the data points.
- In a Cluster Analysis, you group your data points according to how similar they are, resulting in a tree structure.
- In a Network Analysis, you arrange your data in a network structure to understand their connections and the distance between individual data points.
Ordinations
You are doing an ordination. An ordination is... ADD Check the entry on Ordinations (does not yet exist) to learn more.
There is a difference between ordinations for different data types - for abundance data, you use Euclidean distances, and for continuous data, you use Jaccard distances.
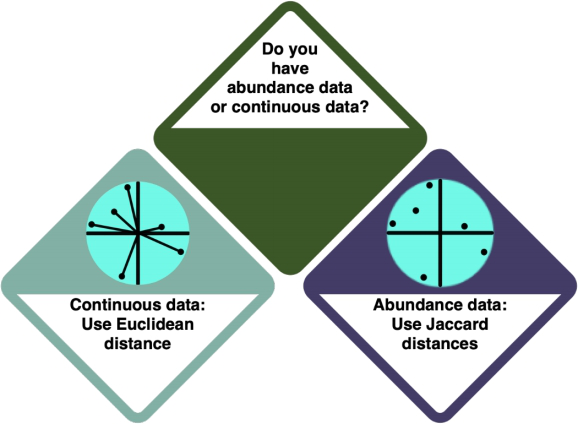

How do I know?
- Check the entry on Data formats to learn more about the different data formats.
- Investigate your data using
strorsummary. Abundance data is marked as FORMATNAME, and continuous data is marked as FORMATNAME.
LINK TO PAGES THAT EXPLAIN LINEAR-BASED ORDINATIONS (EUCLIDEAN) AND CORRESPONDENCE ANALYSIS (JACCARD) (IS THIS EVEN CORRECT?)
Cluster Analysis
So you decided for a Cluster Analysis. A Cluster Analysis is.. ADD Check the entry on Clustering Methods to learn more.
There is a difference to be made here, dependent on whether you want to classify the data based on prior knowledge (supervised) or not (unsupervised). DISTINCTION BETWEEN SUPERVISED AND UNSUPERVISED IS NOT MADE IN THE CLUSTERING ENTRY - ADD THIS!
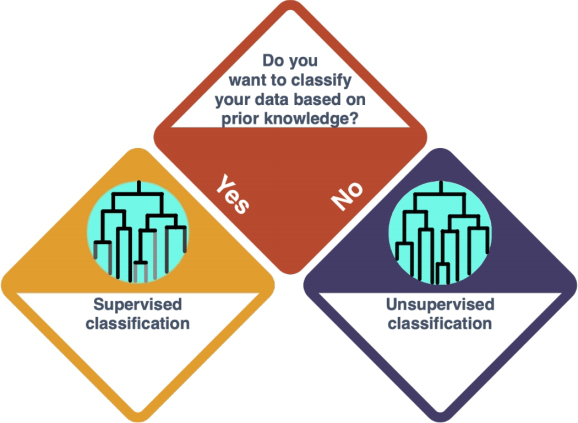

How do I know?
- HOW DO I KNOW IF IT IS BASED ON PRIOR KNOWLEDGE OR NOT?
- WHERE DO WE LINK FOR SUPERVISED AND UNSUPERVISED?
Network Analysis
You have decided to do a Network Analysis. In a Network Analysis is... ADD Check the entry on Social Network Analysis to learn more.
There is a distinction here between bipartite and tripartite networks, with two or three kinds of nodes, respectively.
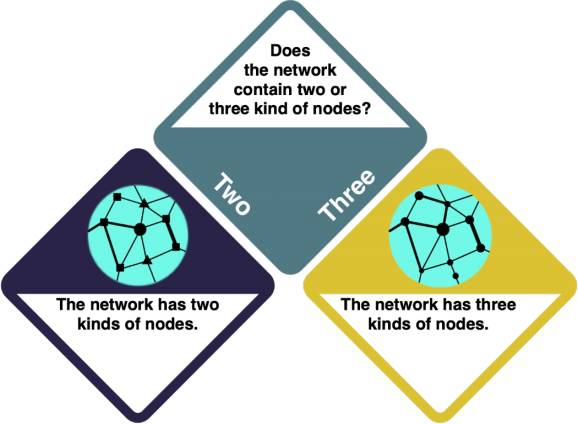

How do I know?
- Check your data using the R code ADD CODE
- MAKE SURE BIPARTITE AND TRIPARTIGE IS EXPLAINED SOMEWHERE (MAYBE HAVE R EXAMPLE ENTRIES)