Difference between revisions of "System Thinking & Causal Loop Diagrams"
| Line 144: | Line 144: | ||
== Key Publications == | == Key Publications == | ||
| − | + | Forrester, J. W. 1961. ''Industrial dynamics.'' Pegasus Communications, Waltham, MA. | |
| + | * The publication that widely introduced system thinking to the world. | ||
| − | + | Haraldsson, H.V. 2004. ''Introduction to System Thinking and Causal Loop Diagrams.'' Reports in ecology and environmental engineering (1). KFS AB, Lund, Sweden. | |
| + | * A brief explanation of System Thinking and a dailed description of how to develop a Causal Loop Diagram. | ||
| − | + | Meadows, D. 2008. ''Thinking in Systems. A Primer.'' Chelsea Green Publishing, Vermont. | |
| + | * An good introduction to the topic in the field of sustainability science. | ||
| − | + | Checkland, P. Systems Thinking. In: Curry, W.L. Galliers, B. 1999. ''Rethinking Managagement Information Systems.'' Oxford University Press. 45-56. | |
| − | + | * Representative for the various contributions Checkland made since the 1970s. | |
| − | |||
| − | |||
| − | |||
| − | |||
| − | |||
| − | Representative for the various contributions Checkland made since the 1970s. | ||
Revision as of 07:29, 23 November 2020
| Method categorization | ||
|---|---|---|
| Quantitative | Qualitative | |
| Inductive | Deductive | |
| Individual | System | Global |
| Past | Present | Future |
Annotation: The method of Causal Loop Diagrams is strongly connected to Systems Thinking. The latter describes a mode of thinking - a way of research - and will be described in this entry, too.
Background
In the 1920s, Russian researcher Alexander Bogdanov formed the first comprehensive theoretical framework revolving around a system, describing the organisation of living and non-living systems (1, p.5). Then, Austrian biologist "Ludvick von Bertalanaffy independently followed up the work of Bogdanov and initiated the general system theories in the 1940s from which the modern cybernetic movement emerged." (Haraldsson 2004, p.5). The 'cybernetic movement', "(...) formed after World War II was a group of mathematicians, neuroscientists, social scientists and engineers, led by Norbert Wiener and John von Neumann. They developed important concepts of feedback and self-regulation within engineering and expanded the concept of studying patterns, which eventually led to theories of self-organisation (...). It enabled a contextual analysis of seeing different system levels interacting in a larger whole, e.g. the interaction of species in an ecosystem or the urban society and people." (Haraldsson 2004, p.6)
Jay Forrester, a MIT computer scientist, subsequently coined the term 'System Dynamics' in the 1960s and was the first to discuss the Causal Loop Diagrams concept. (1) The expression 'Systems Thinking' was introduced by Forrester's student Barry Richmond in 1987 (6). Considerable contributions to the field were voiced by management researcher Peter Checkland from the 1970s on, who built upon the General System Theories (GST) but then introduced the distinction between 'hard' und 'soft' system thinking (see below) (9). "In the sixties and seventies the environmental movement identified many complex problems that integrated the economy and resource management, as a more holistic perspective emerged. The concept "sustainable development" is perhaps the most recognised term to address the need of an interdisciplinary approach. In recent years, the importance of creating an educational basis that incorporates a system approach is increasingly realised, and for the last decade or so System Thinking has been finding its way into universities and corporations." (Haraldsson 2004, p.6; 6)
System Thinking can be applied in any discipline to understand underlying structures and develop models of the system that is analysed. However, sustainability science relies heavily on System Thinking since it acknowledges the complex and lagged interrelationships within and in between ecological, economic, social and further systems. A Key Publication in this field was 'Thinking in Systems' by Donella Meadows, who had been co-authoring the landmark 'Limits to Growth' before. Sustainability Science that attempts to bridge the world how it is with the world how it ought to be relies on System Thinking to understood how the world is and in which 'leverage points' one needs to intervene to bring about change. System Thinking can also be applied outside of scientific research, e.g. to analyze company-internal processes, for marketing purposes etc. (see e.g. 3)
What the method does
Before explaining System Thinking, it should first be explained what is a 'system'.
Systems, System Thinking, System Analysis & System Dynamics
A system is a "(...) network of multiple variables that are connected to each other through causal relationships" that "(...) expresses some sort of behaviour, which can only be characterized through observation as a whole" (Haraldsson 2004, p.11). More simply put, it is a "(...) collection of connected things (...) that influence one another." (Toole 2005, p.2) Both the collection of elements and their interactions are important elements of the system which is emphasized by saying that a system is 'more than a collection of its parts' (Arnold & Wade 2015, p.2).
A system could be a tree, with the leaves and the stem and such elements interacting with each other - but also the tree within the forest, interacting with the soil, the weather, other plants, animals and inanimate objects. This shows that every system is "(...) defined by its boundaries" (Haraldsson 2004, p.13). Each element within the system may be quantifiable, e.g. money or volumes, or rather qualitative, e.g. motivation or well-being (2). For more background on the definition of System Boundaries, please refer to this entry.
The system is at the basis of System Thinking. System Thinking is a form of scientific approach to organizing and understanding 'systems' as well as solving questions related to them. It can be said that every creation of a (scientific) model of a system is an expression of System Thinking, but there is more to System Thinking than just building and working with system models (1). System Thinking revolves around the notion of 'holistic' understanding, i.e. the idea that the components of a system can best be understood by also observing adjacent components and attempting to understand their connections. Among diverging definitions of the term, recurring characteristics of System Thinking are the acknowledgement of non-linear interrelationships between system elements, including feedback loops, that lead to dynamic behavior of the system and make it necessary to examine the whole system instead of only its parts (6). Further, System Thinking assumes that "(...) all system dynamics are in principle non-linear." and that "(...) only non-linear equations are capable of describing systems that follow non-equililbrium conditions" (Haraldsson 2004, p.6).
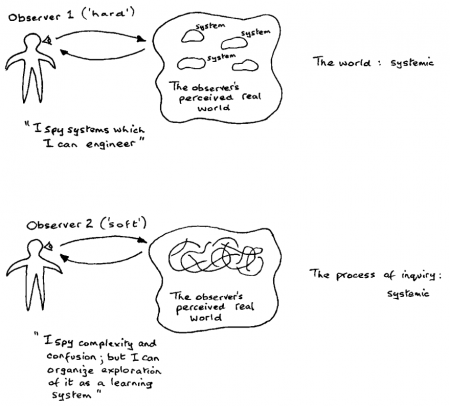
According to Checkland, there are two main types of System Thinking: hard and soft. Hard System Thinking (HST) includes the earlier forms of applied System Thinking that could be found in technology management or engineering. It assumes that the analyzed system is objectively real and in itself systemic, that it can be understood and modeled in a reductionist approach and intervened by an external observer to optimize a problematic situation. HST is defined by understanding the world as a system that has a clear structure, a single set of underlying values and norms and a specific goal (9).
Soft System Thinking (SST), by comparison, considers a 'system' an "(...) epistemological concept which is subjectively constructed by people rather the objective entities in the world" (Zexian & Xuhui 2010, p.143). SST is defined by a systemic and iterative approach to understanding the world and acknowledges that social systems include diverse sets of worldviews and interests (9). In SST, the observer interacts with the system (s)he observes and cannot optimize it, but improve it through active involvement.
System Thinking (especially HST) finds concrete applications in science through two concepts that it builds upon: System Analysis and System Dynamics (1).
System Analysis "(...) is about discovering organisational structures in systems and creating insights into the organisation of causalities. It is about taking a problem apart and reassembling it in order to understand its components and feedback relationships." (Haraldsson 2004, p.5). System Analysis, thus, focuses on understanding the system and being able to recreate it. This is often done through the application of Causal Loop Diagrams, which will be explained below. For more information, refer to the entry on System Analysis.
System Dynamics, then, focuses on the interaction part of the system. It "(...) refers to the re-creation of the understanding of a system and its feedbacks. It aims at exploring dynamic responses to changes within or from outside the system. (...) System Dynamics deals with mathematical representation of our mental models and is a secondary step after we have developed our mental model." (Haraldsson 2004, p.5). System Dynamics, as the name suggests, enables the researcher to observe and measure the behavior of the system. The interactions between the individual elements are not just recreated, but the consequences of these interactions are quantified and assessed.
System Thinking allows for a shift in the perception of causality. Instead of assuming linear causality (A causes B, B causes C) it allows for the integration of further influencing factors, as well as a more neutral depiction of the system at hand. C may now be seen as a property that emerges from the relation between A and B, instead of perceiving it as a direct consequence of B. Haraldsson (2004, p.21) provides an illustrative example here: "We start by asking the initial question: "I want to understand how water flows into the glass what I do to fill it up." Instead of looking at the action from an individual point of view, where the "I am" is the doer and at the centre of focus, we shift our perception to the structure of the action. The "I am" simply becomes a part of the feedback process, not standing apart from it. Suddently we have shifted out attention to the structure of the behavior and we can observe that the structure is causing the behavior. (...) We have now transformed the traditional linear thinking into a circular argument."
Causal Loop Diagrams
Causal Loop Diagrams (CLDs) are a crucial method for System Analysis since they allow for the modelling of systems. They make it possible "(...) to 'map' the complexity of a problem of interest" (McGlashan et al. 2016, p.2). A CLD allows us to not suppose a linear relationship between system elements, but rather understand cause and effect (1). It makes it possible to "(...) understand how a behavior has been manifesting itself in a system so we can develop strategies to work with, or counteract the behavior. We also want to know to what extent and how the problem is connected with other 'systems'" (Haraldsson 2004, p.20). By developing a CLD, one can visualize and thus better understand the feedback mechanisms that happen in a system (1). This visualisation also helps transfer system understanding (1). CLDs "(...) provide a language for articulating our understanding of the dynamic, interconnected nature of our world. (...) By stringing together several loops, we can create a coherent story about a particular problem or issue." (Team TIP 2011, p.1)
A Causal Loop Diagram consists of rather few elements: Variables, Causal Relationships and Polarity.
Variables represent the individual elements of a system, but are adapted to the research intent underlying the creation of the CLD. They are "(...) dynamic causes or effects of the problem under study" (McGlashan et al. 2016, p.2). For example, in a CLD that recreates a forest ecosystem, the system element may be the soil, whereas the variable would be, for example, the change in the amount of carbon in the soil - if this is of interest for the research.
Between these variables, the CLD depicts causal relationships. Causal relationships "(...) are represented by arrows that represent a directed cause from one variable to another" (McGlashan et al. 2016, p.2). When a number of causal relationships (i.e. arrows) connects two or more variables to a circular structure, a loop constitutes.
Each of these causal relationships has one of two polarities (or 'feedbacks'): positive or negative. Note that these are not equal to growth or decline! If the polarity is positive (exhibited by a '+'), the causally related variables change in the same direction: if the first variable grows in size, the other does, too; and if the first variable decreases, so does the second one. Negative polarity ('-') works into opposite directions: if the first variable decreases, the second one increases - and if the first one increases, the second one decreases (1, 3). The polarities influence the outcome of the systemic processes, especially in a loop:
When there are only positive or negative polarities in a loop, there is an amplifying or 'reinforcing' (R) loop. (Please note that 'positive' and 'negative' does not indicate a positive or negative development of ALL stocks. The terms are a little deceiving here.) In a reinforcing loop, one variable may be ever-increasing and the other one ever-decreasing (only negative polarities), or all variables are ever-increasing or decreasing (only positive polarities).
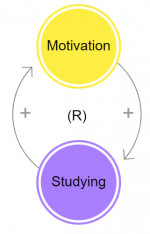
Let's look at an example of a reinforcing loop with positive polarities only: A student's motivation to learn ahead of an exam is causally - and positively ('+') linked to the amount of learning she gets done. If she is not motivated, she will not get much done. And the less she gets done, the less motivated she is... and so on. On the other hand, if she is very motivated, she will get a lot done, which motivates her to do even more. In an ideal world, that is. We all know that this is not always the case, don't worry.
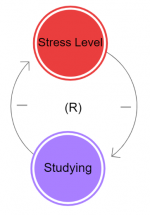
If we looked at this loop with slightly modified variables, purely negative polarities lead to the same result. Say, we substitute 'Motivation' with 'Stress Level': an increase in the stress level decreases the amount of studying, which further increases the stress level, which further decreases the studying. While the stress level escalates into therapeutically dangerous heights, the amount of studying approximates zero. On the other hand, a low stress level allows for a lot of studying, which provides a good feeling and further decreases the stress level.
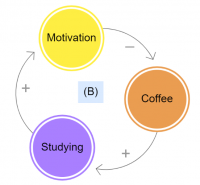
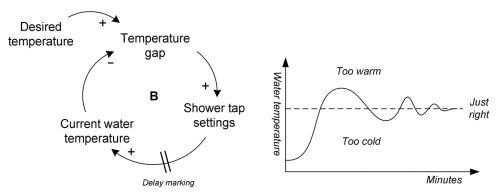
Then, there is the self-regulating or 'balancing' (B) loop where one of the causal relationships hinders the loop from escalating in either direction. In a truly balancing loop, the positive and negative polarities even each other out quantitatively. For example, our exemplary student takes coffee breaks now and then, because - let's admit it - she is a coffee junkie. The less she is motivated, the more coffee she drinks, which motivates her to study more. Studying more increases her motivation, which, however, decreases her coffee consumption. Without coffee, she won't get anything done - and her motivation decreases again. Vicious cycle.
So how does one create a Causal Loop Diagram? The process consists of the following steps (from 1, 2, 3):
1) Define the system boundaries, the time horizon and the question to be answered with the Causal Loop Diagram. The time horizon and system boundaries influence the design of the CLD because some elements may not play a role in short or long time horizons, or in a more narrow or wider perspective on the system.
2) Place the variables that are relevant to the system, starting with just a few very important ones (based on knowledge about the system, e.g. through system analysis). The level of detail (e.g. if your variable is the forest, the individual tree, or its leaves) depends on the research interest and the defined system boundaries. An overly detailed CLD will unnecessarily complicate the latter analysis of the system.
3) Determine the causalities between these variables - which of them are linked with each other? - and draw the respective arrows.
4) Attach the polarities (feedbacks) - either positive or negative - to each linkage.
5) Identify loops in your system and evaluate how each develops over time - does it escalate or regulate itself? Mark them as either balancing (B) or reinforcing (R), accordingly. Note that a loop might include a larger number of variables. Remember: if it is not circular, it is not a loop!
6) Re-iterate. The CLD will not be perfect from the start, so you may change and add variables, decrease or increase the system boundaries and time horizon. However, you should not change the polarities if their original placement was based on sound and data-based knowledge of the interactions.
A few additions may be made to this process.
- There may be further linkages between variables of the loop and external variables that are not immediately part of the loop but still influence the loop's behavior. A generally reinforcing loop can still be balancing if the external feedback prevents escalation (1).
- There may be delays in the feedback. These delays can be signified by drawing to lines across the respective arrow (1)
- Sometimes, one of the loops in a CLD may be more important for the dynamic of the whole system. This loop (or also a single feedback) may be drawn bolder to highlight its weight (1)
- The loops may also follow a sequence, i.e. one or more of the loops is predominant until a specific event happens (e.g. when a certain threshold is passed). Afterwards, another loop is more relevant. This can get complicated - if you want to learn more about these cases, see Haraldsson 2004 in the Key Publications.
Strengths & Challenges
System Thinking provides advantages over linear analyses that do not do complex problems justice.
- System Thinking helps find the real roots of problems instead of applying 'end of pipe' solutions that only fix symptoms, not causes. It also helps not to disimprove things by fixing one element but worsening another one while doing so (1).
- Human thinking often tends to fall into simple cause-and-effect patterns that make it easier to understand the world. Applying System Thinking and the creation of Causal Loop Diagrams may be seen as solutions to this tendency of the human mind to simplify complex relationships where several variables influence each other. It makes it easier to get a feeling for how things really interact, as opposed to a very simplified model that neglects too many interactions. However, one should keep in mind that any model is just a (more or less detailed) approximation of the real world, and sometimes, problems are not as complex as they seem.
However, there are some potential pitfalls when developing Causal Loop Diagrams.
- The variables in the CLD must be quantitatively increasable or decreasable. For example, a variable should not be "attitude towards something", which is too qualitative, but rather "tolerance towards something". The variables should also be self-explanatory and neutral. "[T]he action is in the arrows" (Haroldsson 2004, p.42) (1, 2).
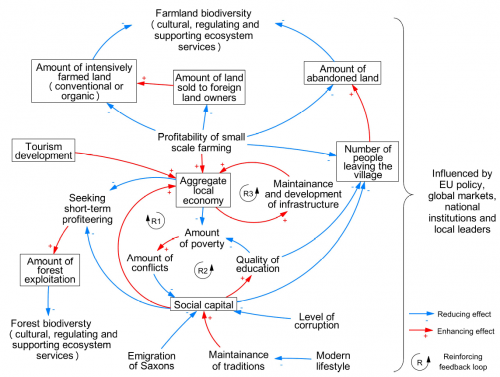
- The communicative purpose of a CLD, it can only be seen as accomplished when the reader / viewer understands the thinking behind the model and the principles that guide the system (1). This is especially relevant since 'Causal Loop Diagrams' can become huge, which makes it increasingly difficult to find root causes for developments and not lose the overview (see Figure above).
Normativity
Everything normative about this method
Chu (2011) raises concerns about the notion of 'systems'. In her view, common definitions of systems (especially those which Checkland would consider 'hard' systems) imply that the 'real' world existed of systems and non-systems, and that the complexity of each system model (which CLDs are a form of) was dependent on how the system 'is'. Instead, she suggests to realise that the complexity of any system model depends on how complex the researcher decides to develop said model: "How much detail one takes into account in models depends entirely on the perspective one takes that is on what needs to be taken into account." (Chu 2011, p.184). Mitchell (2004) claims equally: "The idealized and partial character of our representations suggests that there will never be a single account that can do all the work of describing and explaining complex phenomena. Different degrees of abstraction, attention to different components of a system, are appropriate to our varying pragmatic goals and conceptual and computational abilities." (p.1)
As described above, developing a CLD does include the steps of setting system boundaries and defining the research interest and thus the necessary elements to be included. In this regard, these concerns highlights that a CLD (and any form of system modelling) is always dependent on the previously made decisions and simplifications and any results of the system analysis must acknowledge this. Chu therefore dismisses the idea of quantifying the complexity of systems based on the properties of system models; and Mitchell suggests not to attempt to break down the world into singular reductionist models that do not represent real complexity, but rather to endorse 'integrative pluralism' that combines different models of the same phenomenon and thus allows for more realistic representations. This critique is in line with Checkland's 'soft' system understanding that offers an alternative to the assumption that systems are objectively real and independent from the observer's relation to it (9).
Connectedness
- While Causal Loop Diagrams are a simplified form of System Analysis, the latter involves more diverse approaches.
- To support the analysis of how systemic variables interact with each other, Agent Based Modelling may be applied.
- CLDs may be analyzed using Network Analysis (see 4).
- System Thinking is an important foundation for any method that views interactions between different agents. This is of relevance to methods that support thinking about and planning for the future, most notably Scenario Planning as well as Visioning.
Outlook
Arnold and Wade (2015) describe the increasing growth of complex systems in our daily lives due to increasingly tied international trade relations, technological advancements and international policy decisions that influence other nations. They claim that '[s]ystems, if ever they were separated, are indomitably moving towards interconnectedness as we hurtle into a globalized future. (...) Now, more than ever, systems thinkers are needed to prepare for an increasingly complex, globalized, system of systems future in which everything (...) will produce ripple effects throughout the globe." (p.2)
Key Publications
Forrester, J. W. 1961. Industrial dynamics. Pegasus Communications, Waltham, MA.
- The publication that widely introduced system thinking to the world.
Haraldsson, H.V. 2004. Introduction to System Thinking and Causal Loop Diagrams. Reports in ecology and environmental engineering (1). KFS AB, Lund, Sweden.
- A brief explanation of System Thinking and a dailed description of how to develop a Causal Loop Diagram.
Meadows, D. 2008. Thinking in Systems. A Primer. Chelsea Green Publishing, Vermont.
- An good introduction to the topic in the field of sustainability science.
Checkland, P. Systems Thinking. In: Curry, W.L. Galliers, B. 1999. Rethinking Managagement Information Systems. Oxford University Press. 45-56.
- Representative for the various contributions Checkland made since the 1970s.
References
(1) Haraldsson, H.V. 2004. Introduction to System Thinking and Causal Loop Diagrams. Reports in ecology and environmental engineering (1). KFS AB, Lund, Sweden.
(2) Team TIP. 2011. Guidelines for drawing causal loop diagrams. Systems Thinker 22(1). 5-7.
(3) Toole, M.T. 2005. A Project Management Causal Loop Diagram. ARCOM Conference, London, UK.
(4) McGlashan et al. 2016. Quantifying a Systems Map: Network Analysis of a Childhood Obesity Causal Loop Diagram. PLoS ONE 11(10):
(5) Hanspach et al. 2014. A holistic approach to studying social-ecological systems and its application to Southern Transylvania. Ecology and Society 19(4). 32-45.
(6) Arnold, R.D. Wade, J.P. 2015. A Definition of Systems Thinking: A Systems Approach. 2015 Conference on Systems Engineering Research.
(7) Chu, D. 2011. Complexity: Against Systems. Theory in Biosciences. 182-196.
(8) Mitchell, S. 2004. Why integrative pluralism? Emergence: Complexity and Organization 1. 1-14.
(9) Zexian, Y. Xuhui, Y. 2010. A Revolution in the Field of Systems Thinking - A Review of Checkland's System Thinking. Systems Research and Behavioral Science 27. 140-155.
Further Information
[LOOPY](https://ncase.me/loopy/) is a simple web-based tool for creating your own feedback loops. It's easy to apply and a good start to get to know the process.
The author of this entry is Christopher Franz.
