Difference between revisions of "File:Statistics Flowchart - Cluster Analysis.png"
From Sustainability Methods
(Christopher Franz uploaded a new version of File:Statistics Flowchart - Cluster Analysis.png) |
(Christopher Franz uploaded a new version of File:Statistics Flowchart - Cluster Analysis.png) |
(No difference)
| |
Latest revision as of 14:10, 26 May 2021
Summary
Statistics Flowchart - Cluster Analysis
File history
Click on a date/time to view the file as it appeared at that time.
| Date/Time | Thumbnail | Dimensions | User | Comment | |
|---|---|---|---|---|---|
| current | 14:10, 26 May 2021 | 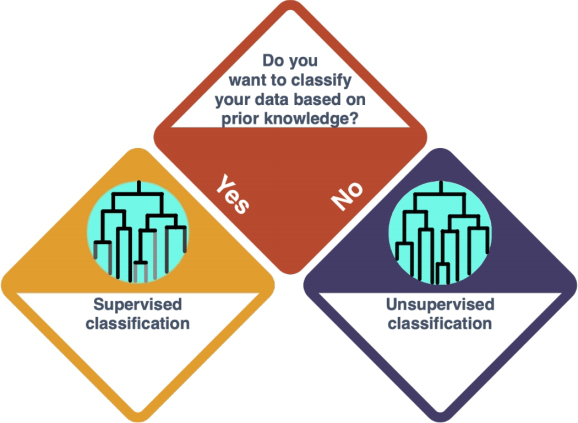 | 578 × 423 (121 KB) | Christopher Franz (talk | contribs) | |
| 09:40, 10 March 2021 | 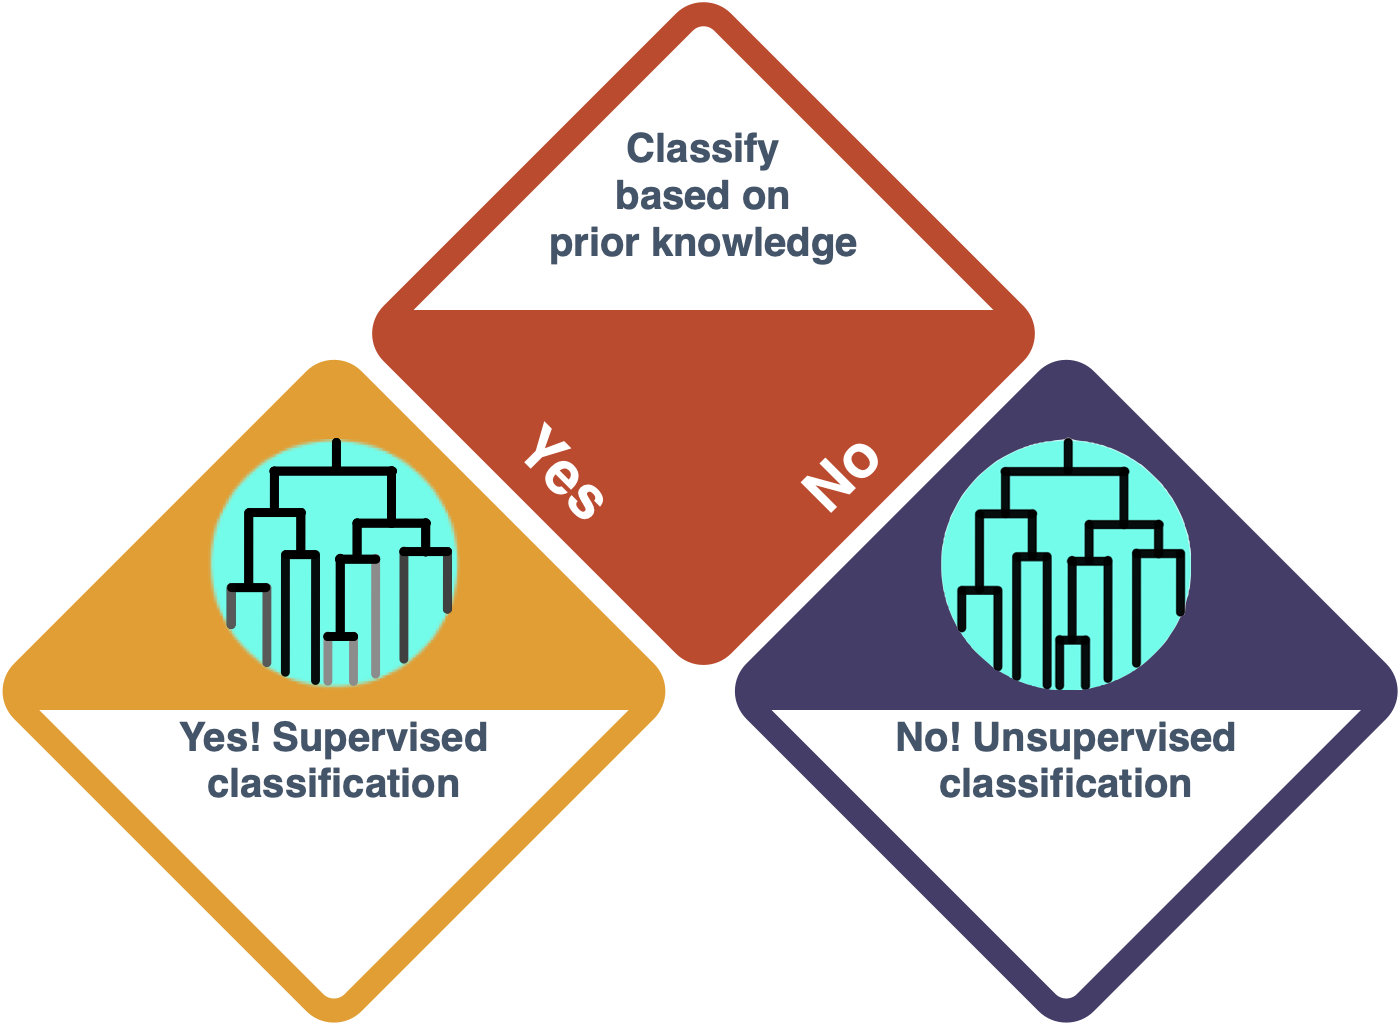 | 1,400 × 1,024 (111 KB) | Christopher Franz (talk | contribs) | Statistics Flowchart - Cluster Analysis | |
| 08:27, 10 March 2021 |  | 1,400 × 1,024 (105 KB) | Christopher Franz (talk | contribs) | Statistics Flowchart - Cluster Analysis |
- You cannot overwrite this file.
File usage
The following page uses this file: