Designing studies
This entry revolves around key things to know when designing a scientific study.
WORK IN PROGRESS
Contents
Before designing the experiment
Please read the entry on Experiments and Hypothesis Testing first.
The principle states that one should not make more assumptions than the minimum needed.
Scientific results are:
- Objective
- Reproducible
- Transferable
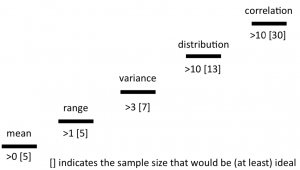
Sample size
Occam's razor the hell out of it!
Population
P-value
In statistical hypothesis testing, the p-value or probability value is the probability of obtaining the test results as extreme as the actual results, assuming that the null hypothesis is correct. In essence, the p-value is the percentage probability the observed results occurred by chance.
Probability is one of the most important concepts in modern statistics. The question whether a relation between two variables is purely by chance, or following a pattern with a certain probability is the basis of all probability statistics (surprise!). In the case of linear relation, another quantification is of central relevance, namely the question how much variance is explained by the model. Between these two numbers -the amount of variance explained by a linear model, and the fact that two variables are not randomly related- are related at least to some amount.
If a model is highly significant, it typically shows a high r2 value. If a model is marginally significant, then the r2 value is typically also low. This relation is however also influenced by the sample size. Linear models and the related p-value describing the model are highly sensitive to sample size. You need at least a handful of points to get a significant relation, while the r2 value in this same small sample sized model may be already high. Hence the relation between sample size, r2 and p-value is central to understand how meaningful models are.
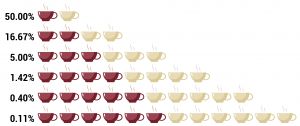
In Fisher's example of a lady tasting tea, a lady claimed to be able to tell whether tea or milk was added first to a cup. Fisher gave her 8 cups, 4 of each variety, in random order. One could then ask what the probability was for her getting the specific number of cups she identified correct, but just by chance. Using the combination formula, where n (total of cups) = 8 and k (cups chosen) = 4, there are 8!/4!(8-4)! = 70 possible combinations. In this scenario, the lady would have a 1.42% chance of correctly guessing the contents of 4 out of 8 cups. If the lady is able to consistently identify the contents of the cups, one could say her results are statistically significant.
Block effects
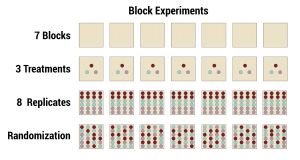
In statistical design theory, blocking is the practice of separating experimental units into similar, separate groups (i.e. "blocks"). A blocking group allows for greater accuracy in the results achieved by removing previously unaccounted for variables. A prime example is blocking an experiment based on male or female sex.
Within each block, multiple treatments can be administered to each experimental unit. A minimum of two treatments are necessary, one of which is the control where, in most cased, "nothing" or a placebo is the treatment.
Replicates of the treatments are then made to ensure results are statistically significant and not due to random chance.
Randomization
You can find this paragraph in the section about Field Experiments.
External links
Articles
Videos
P-Value: What it is and what it tells us
Lady Tasting Tea: The story
The author of this entry is Henrik von Wehrden.


