Venn Diagram
Note: This entry revolves specifically around Venn Diagrams. For more general information on quantitative data visualisation, please refer to Introduction to statistical figures. For more info on Data distributions, please refer to the entry on Data distribution.
Contents
Venn Diagrams
Discription
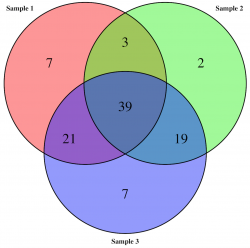
Venn diagrams are a simple way to compare 2-4 groups and their overlaps, allowing for multiple hits. This kind of visualisation allows to see logical relationships between data sets, where each is represented by a circle. The overlaps indicate elements common to both data sets.
R Code
Venn Diagrams are the most useful to visualise relationships between 2-3 datasets, otherwise the diagram becomes difficult to read if used to represent more groups.
The VennDiagram package in R allows to build Venn Diagrams with the help of its in-built function venn.diagram().
#First download and install the VennDiagramm package
install.packages("VennDiagram")
library(VennDiagram)

# let's generate three datasets. Each set would represent a sample
# with identified insect species. The first sample includes 70 insects,
# the second samples includes 63 insects, and the third one includes
# 86 insects.
sample1 <- paste(rep("species_", 70), sample(c(1:100), 70, replace=F), sep="")
sample2 <- paste(rep("species_", 63), sample(c(1:100), 63, replace=F), sep="")
sample3 <- paste(rep("species_", 86), sample(c(1:100), 86, replace=F), sep="")

# Now let's create a venn diagram visualising these three data sets and the number of items
# they have in common. The file with your Venn Diagram will be saved on your hard disk,
# so you can view and use it seperately.
venn.diagram(
  x <- list(sample1, sample2, sample3),
  category.names = c("Sample 1" , "Sample 2 " , "Sample 3"),
  file = "Insects_Vann_diagram1.PNG",
  fill = c("red", "green", "blue"),
  alpha = c(0.5, 0.5, 0.5),
  cex = 2,
  cat.fontface = 2,
  lwd = 2,
)
The author of this entry is Olga Kuznetsova.
