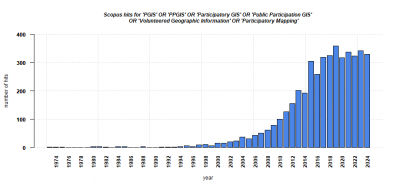
Participatory GIS

Quantitative - Qualitative
Deductive - Inductive
Individual - System - Global
Past - Present - Future
In short: Participatory GIS aims to collect and analyse qualitative spatial data provided by local communities using GIS applications. The collected data is typically used to inform spatial planning processes or published in scientific papers.
Contents
Background
Participatory Geographical Information Systems (PGIS) emerged from a critique of GIS in the 90s and can be linked to critical GIS. Back then, the rise of GIS provoked concerns about potential government control and a return to positivism (Dunn 2007). It was further criticised that GIS privileges certain classes, as it is very technology-focused and that it fails to integrate qualitative information (Mukherjee 2015). From this criticism emerged the idea to incorporate local / traditional / Indigenous spatial knowledge in GIS applications and to provide equitable access to geographic information to marginalized groups in society (Dunn 2007, Mukherjee 2015). The goal was to empower these communities with the aid of technology and to use GIS as a tool for capacity-building and social change (Sieber 2006).
What the method does
Terminology
Up until today, PGIS is dominated by a practical application focus and lacks a unified terminology and understanding (Sieber 2006, Denwood et al. 2022). Participatory approaches to GIS have been evolved in many different disciplines such as urban planning, social work and landscape ecology. They are not limited to an academic context but often include actors from NGOs or public sectors (Sieber 2006). As a result, many different terms and definitions have been established, which are sometimes used interchangeably but can be traced back to different origins.
- Public Participation GIS: The term Public Participatory Geographic Information Systems originates in the US and was coined at a conference about GIS and society in 1993 (Sieber 2006). As the name suggests, PPGIS aims to engage the public in spatial planning and policy-making. Typically, local communities are involved in data gathering that is later used for spatial decision-making (Dunn 2007). PPGIS finds applications in fields such as community planning for neighborhood revitalisation, urban planning or natural resource management and often involves government agencies (Mukherjee 2015, Brown 2016). The goal is to enhance participation and democratic legitimacy and to enable better-informed spatial decisions regarding land-use planning and management (Sieber 2006).
- Participatory GIS: Participatory GIS (PGIS) originates from merging Participatory Learning and Action Methods with GIS technology (Brown 2016). It is commonly applied in non-western contexts with the ambition to empower local, rural and Indigenous communities (Mukherjee 2015). It often involves NGOs and focuses on building social capital (Brown 2016). Possible applications include conflict resolution, protection of land rights or the recording of local knowledge (Mukherjee 2015).
- Volunteered Geographic Information: Volunteered Geographic Information (VGI) focuses on the collection of spatial information and can be associated with Citizen Science (Brown 2016). VGI focuses on tools to create, assemble and disseminate spatial data provided voluntarily by individuals (Brown & Kyttä 2018). An example for such a project is OpenStreetMap.
PPGIS, PGIS and VGI are sometimes compiled under the term “Participatory Mapping” (PM), which can then also include non-digital approaches such as Mental Maps (e.g. Denwood et al. 2022).
Sampling
The sampling strategy should be chosen carefully, as it will influence the outcome (Brown 2016).
| Sampling Strategy | Explanation |
|---|---|
| Random Household Sampling | For random household sampling, a random sample of residential addresses within the area of interest is compiled and from these, specific individuals are invited to participate. This frequently happens via postal contact. Random Household Sampling is often conducted for PPGIS studies. |
| Volunteers | Especially VGI relies on volunteers with an interest in the matter for data collection. They can be invited to participate via communication channels such as social media, flyers or mailing lists. |
| Internet Panels | There are companies who build and maintain databases of individuals willing to participate in survey research. The participants typically receive some form of compensation. |
| On-site recruitment | For on-site recruitment, individuals are recruited directly in the study area, e.g. visitors of a national park. |
| Stakeholder groups | Individuals closely related to the planning or management outcomes are invited to contribute their opinions and expertise. Purposive sampling is more associated with PGIS approaches that focus on engaging community leaders and stakeholders. |
Data collection
Data from participants can be collected using a variety of approaches. These can include self-administered surveys with mapping components, interviews or group mapping in workshops or focus groups (Brown & Fagerholm 2015). Participants are asked to map spatial attributes such as:
- spatial values, perceptions or attributes,
- spatial behaviour pattern, everyday practices and activities,
- spatially defined future preferences or visions.
Non-digital mapping can be done using hardcopy maps or printed aerial images and pencils, pens, threads, stickers etc. to mark locations. Digital mapping often uses map services from google. Commonly, participants are asked to utilise point data rather than more complex forms of representation such as polygons (Brown & Fagerholm 2015). In addition, some information about the participant should be collected, such as age, gender etc. Data from participants can then be combined with other spatial data such as land cover or transportation networks (Fagerholm et al. 2021).
Data analysis
Fagerholm et al. (2021) have proposed three phases for the analysis of PPGIS data. Depending on the research question, not all phases have to be conducted.
- Explore Phase: The explore phase includes the cleaning and organisation of the data as well as descriptive and univariate analyses. Visual outputs are generated and the quality of the collected spatial data is assessed.
- Explain Phase: The explain phase demands more expertise in analytical methods and revolves around establishing links between the data collected from participants and additional spatial data, as well as analyzing spatial patterns. This can involve clustering methods, proximity related analyses or the calculation of indices borrowed from landscape ecology such as richness and abundance.
- Predict Phase: The predict phase includes multivariate modelling and regression models to generalize the findings to other spatial contexts and to gain an understanding of future developments.
Strengths & Challenges
“PPGIS provides a unique approach for engaging the public in decision making through its goal to incorporate local knowledge, integrate and contextualize complex spatial information, allow participants to dynamically interact with input, analyze alternatives, and empower individuals and groups.” (Sieber 2006 p. 503)
Participatory Mapping offers a unique opportunity for describing connections to places and identifying place qualities and values, as well as behaviour patterns and preferences for future land use and management (Brown & Kyttä 2014). “Crowd wisdom” may additionally lead to better land-use and planning decisions (Brown & Fagerholm 2015). This is facilitated by the growing accessibility of relevant tools and technology, such as OpenStreetMap or GPS for the general public. Especially in PGIS contexts, storytelling and sharing of cultural heritage to pass on traditional knowledge to external audiences or the youth may present additional opportunities (Brown & Kyttä 2018). However, there are also some challenges associated with participatory mapping.
Local contexts
Participatory mapping activities are highly dependent on the local context in which they take place. They require a good understanding of local laws, culture, politics and existing power dynamics. The approach must match existing activities and organizational capacity and goals (Sieber 2006). Especially when working with marginalized communities it is crucial to build trust. There may also be geographic, language and communication barriers to be overcome (Brown & Kyttä 2018). Because PGIS/PPGIS approaches are so context-dependent, their generalisability may be limited (Sieber 2006).
Data quality
For data quality of participatory mapping projects, relevance, representativeness and credibility of participants is decisive rather than spatial accuracy as in traditional GIS approaches. To achieve high data quality, the sampling and implementation is therefore crucial. One attempt to measure data quality is to quantify “mapping effort” via the time spent on mapping and the number of markers set. Mapping effort has been found to be highest in groups whose livelihood is closely related to the issue. It has also been reported to be higher in random household sampling rather than in online internet panels (Brown 2017). Results may be influenced by low response rates and barriers to participation (e.g. technology access & skills), spatial discounting, as well as the choice of map scale (Brown 2017, Denwood et al. 2022, Sieber 2006).
Implementation in decision-making
It has been criticised that the actual impact of results from participatory mapping on decision-making is low or not considered in existing studies. This may be due to a mismatch of the time resources that researchers have to complete and publish their studies versus the time it takes to take political decisions regarding land-use. In addition, there may be restrictive federal regulations or zoning in cities that constrain the planning options and conflicting interests to be managed. Participatory mapping is not yet established in planning and management, but the support of related institutions is key, also for providing relevant data (Brown & Kyttä 2018, Mukherjee 2015). The incorporation of participatory mapping in decision-making requires that existing power structures consider lay people to have valuable knowledge that can contribute to planning and management (Brown & Kyttä 2014).
Normativity
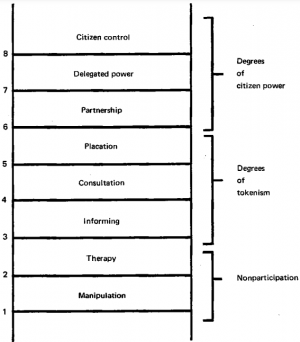
While PGIS/PPGIS were originally developed to empower marginalized communities, in practice, participation often remains shallow (Brown & Kyttä 2018). Usually, a top-down approach is applied where participants mainly provide information for decision-making (Sieber 2006). To achieve the goal of capacity-building, discourse and collaboration would be required rather than just consultation (Brown & Kyttä 2014). In practice, there is often a trade-off between achieving representativeness, which requires large scale surveys, and building social capital, which usually requires smaller groups and workshops (Brown & Fagerholm 2015). In addition to the question of the level of participation achieved, there are numerous ethical considerations to take into account as well. According to Brown & Kyttä (2014) researchers have an obligation to inform participants whether their information will actually be used for decision-making to prevent frustration. In general, it should be ensured that the participation process actually benefits the communities. This is related to questions of access, control and ownership of the spatial data collected and any outputs generated. Sharing place-based knowledge has not always ended well especially for Indigenous communities and there may be potential to enhance conflicts or even to create new ones, instead of solving them (Dunn 2007, Brown & Kyttä 2018).
Outlook
“Best practice has yet to solidify into a coherent body of knowledge as participatory mapping remains more a craft than a science. Methodological pluralism and case study research remain the norm in the field and the quest continues for tangible examples of decision influence in practice.” (Brown & Fagerholm 2015)
A key challenge seems to be a lack of synthesis in the field. While some call for the need of improved cohesion and consistent terminology (Denwood et al. 2022), Brown & Kyttä (2018) claim that integration is unlikely and that rather, specialization within the field will continue. However, PGIS / PPGIS research may benefit from a classification, standardization, and synthesis of the various existing analytical techniques. In addition, experimental designs are needed to compare different approaches and to understand how user behaviour and responses are influenced by user experience (Brown & Kyttä 2018). Further, there is a need to demonstrate measurable outcomes and processes (Brown & Kyttä 2018). This would require the development of measures to assess the impact and effectiveness of PM approaches regarding the influence on decision-making as well as on social impact. In this regard, more long-term case studies are needed that include an assessment of the influence on decision-making.
An Exemplary Study
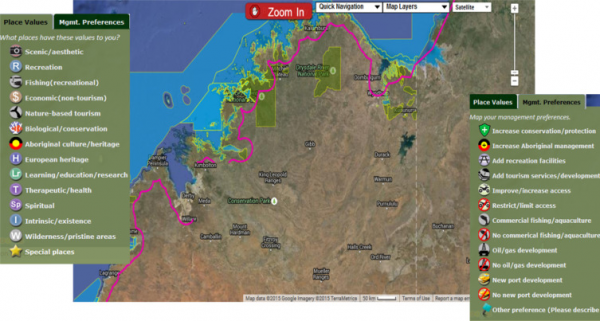
Strickland-Munro et al. (2016) have conducted a PPGIS study in Kimberley, Australia to gain social data for marine spatial planning. Kimberley is a vast and remote area in the north-west of Australia, with high levels of wilderness, biodiversity and cultural heritage. Several marine protected areas (MPAs) have been proposed for the region. Since MPAs may have adverse social impacts and can for example lead to conflicts with local fisheries, the authors were interested in collecting spatial data on stakeholder’s values and management preferences. The authors targeted various stakeholder groups such as local residents, Aboriginal traditional owners and actors from the fishing and tourism industry which were invited by e.g. emails, postal letters or via the newspaper. Participants were asked to map place values and management preferences using predefined categories by dragging and dropping markers on a digital map interface. To ensure a certain accuracy, participants were required to zoom in to a minimum scale to be able to place a marker. After the mapping exercise, additional data such as socio-demographic data was obtained.
Data was analysed by calculating social landscape metrics for each MPA. The authors found a diversity of values, which might point to potential for conflict. They also found that while the accessibility of an area influences the number of mapped attributes, remote areas still have significant value associations, highlighting that remoteness does not guarantee that changes in the management of these areas will be conflict-free. In addition, “hotspots” of high valuation outside of protected areas could be identified. However, the study also has a clear limitation: while 43.5 % of the population identifies as Indigenous, this part of the population was greatly underrepresented with 4.3 % in this study. Participants were also older, better educated and from higher income households than the average population. The authors conclude that to achieve better representation, online platforms might not be the right tool and in-person approaches may achieve better results.
More examples:
- In this study by Matias et al. (2017), participatory mapping was conducted with Indigenous people to learn about the spatial distribution of giant honey bee nests in a community forest in the Philippines. Bee nests were mapped by the local people using GPS devices and digital cameras. The study highlights the importance of adequate social and technical preparation and mutual trust-building.
- In this study by Bernard et al. (2011), local communities in Amazonas State, Brazil, were asked to map houses, areas used for agriculture and animal raising, hunting, fishing and extraction of natural resources on printed satellite images to better understand the socio-economic context of the area, which is protected as a sustainable use reserve. The spatial information from the joint mapping was complemented by semi-structured interviews, verified by covering the area by foot or boat and finally digitized. The authors conclude that the collection and mapping of such data should be a prerequisite for establishing sustainable use reserves.
Key Publications
- Brown, Greg, and Marketta Kyttä. 2014. “Key Issues and Research Priorities for Public Participation GIS (PPGIS): A Synthesis Based on Empirical Research.” Applied Geography 46 (December): 122–36. https://doi.org/10.1016/j.apgeog.2013.11.004.
- Dunn, Christine E. 2007. “Participatory GIS — a People’s GIS?” Progress in Human Geography 31 (5): 616–37. https://doi.org/10.1177/0309132507081493.
- Mukherjee, Falguni. 2015. “Public Participatory GIS.” Geography Compass 9 (7): 384–94. https://doi.org/10.1111/gec3.12223.
- Sieber, Renee. 2006. “Public Participation Geographic Information Systems: A Literature Review and Framework.” Annals of the Association of American Geographers 96 (3): 491–507. https://doi.org/10.1111/j.1467-8306.2006.00702.x.
References
- Arnstein, Sherry R. 1969. “A Ladder of Citizen Participation.” Journal of the American Institute of Planners 35 (4): 216–24. https://doi.org/10.1080/01944366908977225.
- Brown, Greg. 2016. “A Review of Sampling Effects and Response Bias in Internet Participatory Mapping (PPGIS/PGIS/VGI).” Transactions in GIS 21 (1): 39–56. https://doi.org/10.1111/tgis.12207.
- Brown, Greg, and Nora Fagerholm. 2015. “Empirical PPGIS/PGIS Mapping of Ecosystem Services: A Review and Evaluation.” Ecosystem Services 13 (November): 119–33. https://doi.org/10.1016/j.ecoser.2014.10.007.
- Brown, Greg, and Marketta Kyttä. 2014. “Key Issues and Research Priorities for Public Participation GIS (PPGIS): A Synthesis Based on Empirical Research.” Applied Geography 46 (December): 122–36. https://doi.org/10.1016/j.apgeog.2013.11.004.
- Brown, Greg, and Marketta Kyttä. 2018. “Key Issues and Priorities in Participatory Mapping: Toward Integration or Increased Specialization?” Applied Geography 95 (April): 1–8. https://doi.org/10.1016/j.apgeog.2018.04.002.
- Denwood, Timna, Jonathan J. Huck, and Sarah Lindley. 2022. “Participatory Mapping: A Systematic Review and Open Science Framework for Future Research.” Annals of the American Association of Geographers 112 (8): 2324–43. https://doi.org/10.1080/24694452.2022.2065964.
- Dunn, Christine E. 2007. “Participatory GIS — a People’s GIS?” Progress in Human Geography 31 (5): 616–37. https://doi.org/10.1177/0309132507081493.
- Fagerholm, Nora, Christopher M. Raymond, Anton Stahl Olafsson, Gregory Brown, Tiina Rinne, Kamyar Hasanzadeh, Anna Broberg, and Marketta Kyttä. 2021. “A Methodological Framework for Analysis of Participatory Mapping Data in Research, Planning, and Management.” International Journal of Geographical Information Science, January, 1-28. https://doi.org/10.1080/13658816.2020.1869747.
- Mukherjee, Falguni. 2015. “Public Participatory GIS.” Geography Compass 9 (7): 384–94. https://doi.org/10.1111/gec3.12223.
- Sieber, Renee. 2006. “Public Participation Geographic Information Systems: A Literature Review and Framework.” Annals of the Association of American Geographers 96 (3): 491–507. https://doi.org/10.1111/j.1467-8306.2006.00702.x.
- Strickland-Munro, Jennifer, Halina Kobryn, Greg Brown, and Susan A. Moore. 2016. “Marine Spatial Planning for the Future: Using Public Participation GIS (PPGIS) to Inform the Human Dimension for Large Marine Parks.” Marine Policy 73 (August): 15–26. https://doi.org/10.1016/j.marpol.2016.07.011.
Further Information
- https://vimeo.com/193380336 - A short movie about a participatory mapping initiative in Uganda.
-
https://www.ppgis.net/ - An online forum for practitioners, activists, researchers, staff from international organisations, NGOs and government agencies involved in PGIS/PPGIS/VGI.
- They have uploaded a chapter on practical ethics: https://www.ppgis.net/wp-content/uploads/2015/06/ch14_rambaldi_pp106-113.pdf.
- https://participatorymapping.org/ - The Participatory Mapping Institute aims to create a global network of researchers and practitioners involved in PGIS / PPGIS.
The author of this entry is Hannah Metke.


