Unused files
From Sustainability Methods
The following files exist but are not embedded in any page. Please note that other web sites may link to a file with a direct URL, and so may still be listed here despite being in active use.
Showing below up to 211 results in range #1 to #211.
View (previous 500 | next 500) (20 | 50 | 100 | 250 | 500)
- Error creating thumbnail: File missingHistogram (chart structure).svg 744 × 524; 96 KB
 Book1.xls ; 25 KB
- Book2.xlsx ; 8 KB
- Presentation1.ppt ; 83 KB
- Test File.doc ; 27 KB
- Test File asdf.docx ; 12 KB
 Test File.pdf ; 61 KB
- Data 1.csv ; 40 bytes
 New Text Document.txt ; 34 bytes
- Sdf.pptx ; 31 KB
 Another Case of Binary Data.jpg 623 × 640; 73 KB
 Traffic Lights Green.jpg 426 × 640; 74 KB
 Continuous Data.jpg 1,280 × 853; 571 KB
 Likert scale.jpg 1,200 × 1,283; 75 KB
- Error creating thumbnail: File with dimensions greater than 12.5 MPHjsahdash.jpg 4,928 × 3,264; 4.32 MB
 Bildschirmfoto 2019-10-18 um 11.08.57.png 817 × 763; 51 KB
 Bildschirmfoto 2019-10-18 um 11.20.47.png 817 × 763; 42 KB
 Flat Earth.jpg 1,376 × 774; 171 KB
 Simple Histogram.png 500 × 400; 4 KB
 Better Histogram.png 500 × 400; 5 KB
 Basic Scatter Plot.png.png 500 × 400; 3 KB
 Better Scatter Plot.png 500 × 400; 4 KB
 Data Formats Table.jpg 3,543 × 1,654; 1.09 MB
 Data Formats Table small.jpg 2,069 × 966; 175 KB
 Data Formats Table small 2.jpg 600 × 280; 175 KB
 Data Formats Table small 3.jpg 800 × 373; 46 KB
 Data Formats Table small 4.jpg 770 × 359; 43 KB
 Data Formats Table small 5.jpg 750 × 350; 40 KB
 Data Formats Table small 6.jpg 720 × 336; 38 KB
 Bildschirmfoto 2019-10-18 um 11.28.30 Kopie.png 817 × 763; 45 KB
 ModerateCorrelationStudentsAttitudeCorrectAnswer.png 818 × 762; 43 KB
 NoCorrelationSwissInfantMortalityCatholic.png 818 × 762; 43 KB
 ModerateNegativeCorrelationSwissFertilityExamination.png 818 × 762; 52 KB
 Sherlock Holmes.jpg 917 × 1,012; 872 KB
 Bildschirmfoto 2020-01-17 um 10.36.55.png 762 × 207; 49 KB
 Bildschirmfoto 2020-01-17 um 10.48.41.png 843 × 479; 88 KB
 StronNegativeCorrelation.png 612 × 502; 83 KB
 WeakNegativeCorrelation.png 612 × 502; 85 KB
- Error creating thumbnail: File with dimensions greater than 12.5 MPBlack-swan.jpg 6,000 × 4,000; 3.06 MB
 RScript Residuals.png 897 × 365; 58 KB
 Stairs.jpg 338 × 507; 41 KB
 Cognitive Bias.png 750 × 600; 306 KB
 GapminderWeightRanked.png 1,439 × 900; 186 KB
 Bildschirmfoto 2020-03-31 um 10.30.57.png 633 × 383; 90 KB
 Bildschirmfoto 2020-04-26 um 17.52.52.png 782 × 521; 637 KB
 Bildschirmfoto 2020-04-27 um 11.39.32.png 263 × 193; 99 KB
 Bildschirmfoto 2020-04-27 um 11.46.37.png 1,024 × 685; 988 KB
 Bildschirmfoto 2020-05-21 um 15.51.13.png 701 × 701; 481 KB
 Bildschirmfoto 2020-05-21 um 17.13.37.png 367 × 295; 78 KB
 ConceptPresent.png 641 × 614; 81 KB
 ConceptPast.png 735 × 683; 100 KB
 ConceptFuture.png 724 × 670; 101 KB
 ConceptDelphi.png 960 × 540; 43 KB
 ConceptSemi-structuredInterview.png 960 × 540; 34 KB
 ConceptOpenInterview.png 960 × 540; 33 KB
 ConceptVisioning.png 960 × 540; 43 KB
 ConceptGroundedTheory.png 960 × 540; 34 KB
 Bildschirmfoto 2020-06-22 um 08.53.11.png 940 × 701; 538 KB
 1280px-Trolley Problem.svg.png 1,280 × 437; 19 KB
 ConceptSeriousGaming.png 960 × 540; 33 KB
 Barplot example.png 722 × 441; 6 KB
 Ftest example1.png 722 × 441; 5 KB
 Ftest example2.png 722 × 441; 5 KB
 Image.png 720 × 318; 74 KB
 Linear model example.png 589 × 442; 6 KB
 Hist cars$speed.png 589 × 442; 5 KB
 Hist cars$dist.png 589 × 442; 4 KB
 Log cor plot example.png 589 × 442; 5 KB
 Rplot01.png 553 × 365; 18 KB
 ConceptContentAnalysis.png 960 × 540; 43 KB
 ConceptVideobasedResearch.png 960 × 540; 34 KB
 ConceptSystematicLiteratureReview.png 960 × 540; 41 KB
 ConceptLifeCycleAnalysis.png 960 × 540; 34 KB
 ConceptCitizenScience.png 960 × 540; 34 KB
 ChooseYourLevel.png 926 × 752; 162 KB
 Chooseyourweapon.png 1,164 × 936; 206 KB
 GoogleScholarAuthorFollow.png 1,748 × 992; 265 KB
 Teamwork.png 1,280 × 1,256; 272 KB
 ConceptCohortStudy.png 960 × 540; 45 KB
 ConceptEthnography.png 960 × 540; 34 KB
 ConceptVisualisationScenarioPlanning.png 960 × 540; 43 KB
 ConceptHermeneutics.png 960 × 540; 42 KB
- Error creating thumbnail: File with dimensions greater than 12.5 MPPexels-burst-373883.jpg 5,590 × 3,727; 2.24 MB
 New-Article-700x300.jpg 700 × 300; 76 KB
 Evolutionslehredarwin102 v-gseapremiumxl.jpg 704 × 396; 49 KB
 Causal Loop Diagram Visualisation.png 960 × 540; 45 KB
 Causal Loop External Influence.png 342 × 258; 15 KB
 ConceptLivingLab.png 960 × 540; 43 KB
 Climatechange reasonmagazine.jpg 856 × 642; 64 KB
 Quantitativ-qualitativ studilektor.png 287 × 175; 14 KB
 Globalscale palife.jpg 1,000 × 562; 555 KB
 Time mexperience.jpg 1,200 × 800; 105 KB
 Dolphins.jpg 1,920 × 1,080; 148 KB
 Think-in-colour-What-is-Graphic-Recording.jpeg 2,772 × 2,067; 325 KB
 ConceptLegalResearch.png 960 × 540; 44 KB
 Thought Experiment Concept Visualisation.png 960 × 540; 43 KB
 GIS example.png 1,425 × 730; 44 KB
 GIS example USA.gif 1,024 × 603; 179 KB
- Error creating thumbnail: File with dimensions greater than 12.5 MPCommunication.jpg 5,472 × 3,648; 2.13 MB
 ConceptClusteringMethods.png 960 × 540; 46 KB
 ConceptMachineLearning.png 960 × 540; 58 KB
 Cookies.jpg 1,280 × 847; 142 KB
 Plant Growth Experiment.jpg 910 × 683; 89 KB
 Coffee.jpg 1,200 × 874; 233 KB
 Basketball.jpg 800 × 505; 76 KB
 ConceptSocialNetworkAnalysis.png 960 × 540; 41 KB
 Systematic Literature Review - Example.jpg 2,546 × 1,966; 1.8 MB
 Concept Meta-Analysis.png 960 × 540; 42 KB
 Scenario Planning Building Blocks.png 398 × 354; 51 KB
 R - data inspection - swiss example.png 1,456 × 1,120; 295 KB
 Formula1.png 359 × 97; 10 KB
 Formula2.png 60 × 52; 5 KB
 Formula3.png 50 × 46; 5 KB
 Formula4.png 241 × 81; 8 KB
 Formula5.png 26 × 33; 4 KB
 Formula6.png 38 × 36; 4 KB
 Concept visualisation - Experiments.png 960 × 540; 32 KB
 Serious Gaming example.png 468 × 400; 433 KB
 ConceptNarrativeResearch.png 960 × 540; 43 KB
 ConceptCorrelation.png 960 × 540; 57 KB
 Asdf.png 1,298 × 785; 109 KB
 ConceptOrdination.png 1,099 × 620; 66 KB
 PosterComparison.png 1,360 × 839; 1.55 MB
 ConceptGLM.png 960 × 540; 56 KB
 ConceptMixedEffectModels.png 960 × 540; 58 KB
 ConceptVideoResearch.png 960 × 540; 44 KB
 SimpleTestsCategorisation.png 536 × 531; 65 KB
 SimpleTestsCategorisation 1.png 960 × 540; 57 KB
 Barplot.png 690 × 682; 21 KB
 Piechart.png 520 × 490; 28 KB
 2barplots.png 1,310 × 746; 43 KB
 Multi uni.png 1,620 × 630; 156 KB
 Notchformula.png 938 × 260; 29 KB
 ConceptRegression.png 960 × 540; 57 KB
 MilesHorsepower.png 1,344 × 890; 91 KB
 ConceptANOVA.png 960 × 540; 45 KB
 Mindmap Example 1.webp 1,311 × 819; 74 KB
 ConceptFocusGroups.png 960 × 540; 42 KB
 Typography.jpg 600 × 888; 114 KB
 ConceptBayesianInference.png 960 × 540; 58 KB
- Qqplot.pdf ; 5 KB
- Qqplot notnormal.pdf ; 6 KB
 Interview Sankey.png 1,502 × 650; 335 KB
 Statistics Flowchart - First Step.png 578 × 423; 94 KB
 Statistics Flowchart - ANOVA - data format.png.png 366 × 275; 47 KB
 Teamwork - Image for Skills & Tools.jpg 1,920 × 1,280; 490 KB
 Software - Image for Skills & Tools.jpg 1,920 × 1,277; 208 KB
 Personal Skills - Image for Skills & Tools.jpg 1,920 × 1,280; 425 KB
 Productivity Tools - Image for Skills & Tools.jpg 1,920 × 1,280; 244 KB
 ConceptIconology.png 960 × 540; 56 KB
 Iconology - Steps.png 624 × 260; 31 KB
 ConceptGroupConceptMapping.png 960 × 540; 46 KB
 GIS - Vector Point.png 300 × 205; 2 KB
 GIS - Vector Line.png 300 × 205; 6 KB
 GIS - Vector Polygon.png 300 × 205; 10 KB
 GIS - Raster.png 628 × 550; 101 KB
 GIS - Exemplary Study - Partelow et al. 2015 - Title.png 1,647 × 186; 59 KB
 ConceptSurveyResearch.png 960 × 540; 43 KB
 ConceptSupplyChainAnalysis.png 960 × 540; 44 KB
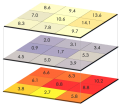
 Q-Methodology.png 1,620 × 1,570; 183 KB
 Hvw logo.jpg 2,783 × 2,750; 422 KB
 ConceptWALKINGEXERCISE.png 960 × 540; 57 KB
 ConceptMACROINVERTEBRATES.png 960 × 540; 45 KB
 ConceptDENDROCHRONOLOGY.png 960 × 540; 60 KB
 ConceptBIRDS.png 960 × 540; 44 KB
 Scatter plot.PNG 982 × 492; 30 KB
 Decomposition 1.PNG 815 × 353; 21 KB
 Decomposition 2.PNG 787 × 284; 11 KB
 Decomposition 3.PNG 770 × 334; 27 KB
 MA plot.PNG 1,057 × 311; 32 KB
 ACF plot.PNG 1,055 × 331; 19 KB
 Outlier plot.PNG 667 × 516; 52 KB
 Forecast plot.PNG 1,079 × 329; 24 KB
 Figure 1.PNG 990 × 497; 35 KB
 New attempt.PNG 676 × 424; 24 KB
 Zotero adding literature to Word 1.png 349 × 106; 6 KB
 Notion Logo.png 2,000 × 2,000; 331 KB
 Covid 19 vaccine.jpg 2,909 × 1,496; 1.92 MB
 Qual indu glob futu.png 658 × 617; 64 KB
- Multivariate vs. univariate.pdf ; 147 KB
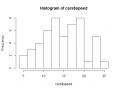
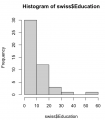 Histogram swiss$Education.png 760 × 866; 52 KB
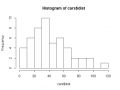
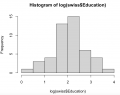 Histogram swiss$Edlog.png 1,006 × 800; 59 KB
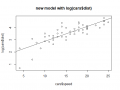
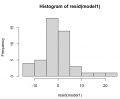 Histogram model1swiss$Ed.png 986 × 810; 53 KB
 Histogram model2swiss$Ed.png 1,002 × 808; 57 KB
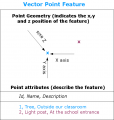 Point feature vector.png 625 × 659; 51 KB
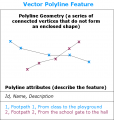 Polyline feature vector.png 625 × 659; 55 KB
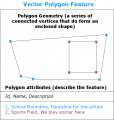 Polygon feature.png 625 × 659; 56 KB
 Example 1.jpg 3,365 × 1,619; 370 KB
 Resolution.jpg 426 × 277; 24 KB
 Extent.jpg 1,652 × 744; 120 KB
 Extent Resolution.jpg 1,646 × 641; 117 KB
 Basemap1.jpg 3,507 × 2,480; 316 KB
 Thematic map.jpg 684 × 768; 150 KB
 Thematic map 2.jpg 1,280 × 720; 108 KB
 Elevation Surface Map.jpg 3,507 × 2,480; 166 KB
 GCS.jpg 899 × 562; 82 KB
 Crs2.jpg 292 × 172; 9 KB
 Figure2-projections.png 2,092 × 1,436; 1.22 MB
 Lat Lon.webp 1,850 × 2,000; 259 KB
 Dat man.jpg 649 × 535; 26 KB
 Data Management.jpg 1,029 × 424; 39 KB
 Germany-Map.jpg 1,538 × 2,000; 460 KB
 Population density in Germany.png 1,400 × 1,800; 483 KB
 Ger.jpg 3,507 × 2,480; 461 KB
 Leuphana.jpg 1,168 × 676; 88 KB
 GIS.jpg 634 × 531; 26 KB
 Bern form1.png 443 × 82; 6 KB
 Example Delphi.png 361 × 456; 64 KB


.svg)