Unused files
From Sustainability Methods
The following files exist but are not embedded in any page. Please note that other web sites may link to a file with a direct URL, and so may still be listed here despite being in active use.
Showing below up to 100 results in range #101 to #200.
View (previous 100 | next 100) (20 | 50 | 100 | 250 | 500)
 ConceptMachineLearning.png 960 × 540; 58 KB
 Cookies.jpg 1,280 × 847; 142 KB
 Plant Growth Experiment.jpg 910 × 683; 89 KB
 Coffee.jpg 1,200 × 874; 233 KB
 Basketball.jpg 800 × 505; 76 KB
 ConceptSocialNetworkAnalysis.png 960 × 540; 41 KB
 Systematic Literature Review - Example.jpg 2,546 × 1,966; 1.8 MB
 Concept Meta-Analysis.png 960 × 540; 42 KB
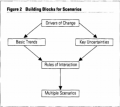 Scenario Planning Building Blocks.png 398 × 354; 51 KB
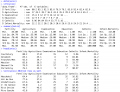 R - data inspection - swiss example.png 1,456 × 1,120; 295 KB
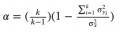 Formula1.png 359 × 97; 10 KB
 Formula2.png 60 × 52; 5 KB
 Formula3.png 50 × 46; 5 KB
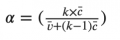 Formula4.png 241 × 81; 8 KB
 Formula5.png 26 × 33; 4 KB
 Formula6.png 38 × 36; 4 KB
 Concept visualisation - Experiments.png 960 × 540; 32 KB
 Serious Gaming example.png 468 × 400; 433 KB
 ConceptNarrativeResearch.png 960 × 540; 43 KB
 ConceptCorrelation.png 960 × 540; 57 KB
 Asdf.png 1,298 × 785; 109 KB
 ConceptOrdination.png 1,099 × 620; 66 KB
 PosterComparison.png 1,360 × 839; 1.55 MB
 ConceptGLM.png 960 × 540; 56 KB
 ConceptMixedEffectModels.png 960 × 540; 58 KB
 ConceptVideoResearch.png 960 × 540; 44 KB
 SimpleTestsCategorisation.png 536 × 531; 65 KB
 SimpleTestsCategorisation 1.png 960 × 540; 57 KB
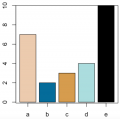 Barplot.png 690 × 682; 21 KB
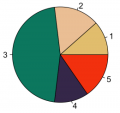 Piechart.png 520 × 490; 28 KB
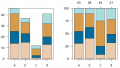 2barplots.png 1,310 × 746; 43 KB
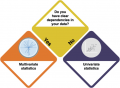
 Multi uni.png 1,620 × 630; 156 KB
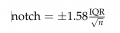 Notchformula.png 938 × 260; 29 KB
 ConceptRegression.png 960 × 540; 57 KB
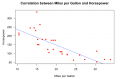 MilesHorsepower.png 1,344 × 890; 91 KB
 ConceptANOVA.png 960 × 540; 45 KB
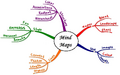 Mindmap Example 1.webp 1,311 × 819; 74 KB
 ConceptFocusGroups.png 960 × 540; 42 KB
 Typography.jpg 600 × 888; 114 KB
 ConceptBayesianInference.png 960 × 540; 58 KB
 Qqplot.pdf ; 5 KB
- Qqplot notnormal.pdf ; 6 KB
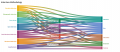 Interview Sankey.png 1,502 × 650; 335 KB
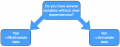
 Statistics Flowchart - First Step.png 578 × 423; 94 KB
 Statistics Flowchart - ANOVA - data format.png.png 366 × 275; 47 KB
 Teamwork - Image for Skills & Tools.jpg 1,920 × 1,280; 490 KB
 Software - Image for Skills & Tools.jpg 1,920 × 1,277; 208 KB
 Personal Skills - Image for Skills & Tools.jpg 1,920 × 1,280; 425 KB
 Productivity Tools - Image for Skills & Tools.jpg 1,920 × 1,280; 244 KB
 ConceptIconology.png 960 × 540; 56 KB
 Iconology - Steps.png 624 × 260; 31 KB
 ConceptGroupConceptMapping.png 960 × 540; 46 KB
 GIS - Vector Point.png 300 × 205; 2 KB
 GIS - Vector Line.png 300 × 205; 6 KB
 GIS - Vector Polygon.png 300 × 205; 10 KB
 GIS - Raster.png 628 × 550; 101 KB
 GIS - Exemplary Study - Partelow et al. 2015 - Title.png 1,647 × 186; 59 KB
 ConceptSurveyResearch.png 960 × 540; 43 KB
 ConceptSupplyChainAnalysis.png 960 × 540; 44 KB
 Q-Methodology.png 1,620 × 1,570; 183 KB
 Hvw logo.jpg 2,783 × 2,750; 422 KB
 ConceptWALKINGEXERCISE.png 960 × 540; 57 KB
 ConceptMACROINVERTEBRATES.png 960 × 540; 45 KB
 ConceptDENDROCHRONOLOGY.png 960 × 540; 60 KB
 ConceptBIRDS.png 960 × 540; 44 KB
 Scatter plot.PNG 982 × 492; 30 KB
 Decomposition 1.PNG 815 × 353; 21 KB
 Decomposition 2.PNG 787 × 284; 11 KB
 Decomposition 3.PNG 770 × 334; 27 KB
 MA plot.PNG 1,057 × 311; 32 KB
 ACF plot.PNG 1,055 × 331; 19 KB
 Outlier plot.PNG 667 × 516; 52 KB
 Forecast plot.PNG 1,079 × 329; 24 KB
 Figure 1.PNG 990 × 497; 35 KB
 New attempt.PNG 676 × 424; 24 KB
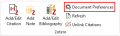 Zotero adding literature to Word 1.png 349 × 106; 6 KB
 Notion Logo.png 2,000 × 2,000; 331 KB
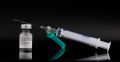 Covid 19 vaccine.jpg 2,909 × 1,496; 1.92 MB
 Qual indu glob futu.png 658 × 617; 64 KB
- Multivariate vs. univariate.pdf ; 147 KB
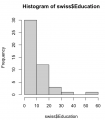 Histogram swiss$Education.png 760 × 866; 52 KB
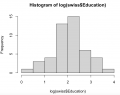 Histogram swiss$Edlog.png 1,006 × 800; 59 KB
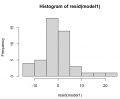 Histogram model1swiss$Ed.png 986 × 810; 53 KB
 Histogram model2swiss$Ed.png 1,002 × 808; 57 KB
 Point feature vector.png 625 × 659; 51 KB
 Polyline feature vector.png 625 × 659; 55 KB
 Polygon feature.png 625 × 659; 56 KB
 Example 1.jpg 3,365 × 1,619; 370 KB
 Resolution.jpg 426 × 277; 24 KB
 Extent.jpg 1,652 × 744; 120 KB
 Extent Resolution.jpg 1,646 × 641; 117 KB
 Basemap1.jpg 3,507 × 2,480; 316 KB
 Thematic map.jpg 684 × 768; 150 KB
 Thematic map 2.jpg 1,280 × 720; 108 KB
 Elevation Surface Map.jpg 3,507 × 2,480; 166 KB
 GCS.jpg 899 × 562; 82 KB
 Crs2.jpg 292 × 172; 9 KB


