Main page
About this Wiki
Glossary
Method Recommendation Tool
Blog
Random page
Help about MediaWiki
Create account
Log in
File list
From Sustainability Methods
Jump to:
navigation
,
search
This special page shows all uploaded files.
File list
Items per page:
20
50
100
250
500
Search for media name:
Username:
Include old versions of files
Go
First page
Previous page
Next page
Last page
Date
Name
Thumbnail
Size
Description
Versions
19:13, 25 January 2021
Formula5.png
(
file
)
4 KB
1
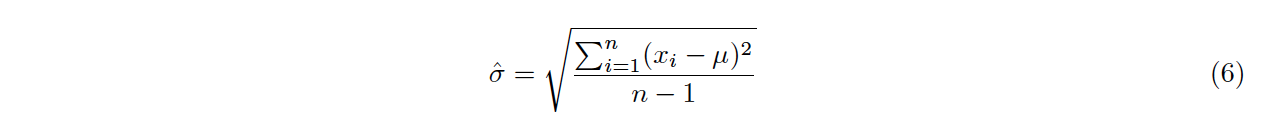
19:14, 25 January 2021
Formula6.png
(
file
)
4 KB
1
19:12, 25 January 2021
Formula3.png
(
file
)
5 KB
1
19:11, 25 January 2021
Formula2.png
(
file
)
5 KB
1
19:12, 25 January 2021
Formula4.png
(
file
)
8 KB
1
09:07, 21 March 2022
Prbdistribution2.png
(
file
)
10 KB
450px|frameless|center
1
19:10, 25 January 2021
Formula1.png
(
file
)
10 KB
1
09:12, 21 March 2022
Prbdst4.png
(
file
)
12 KB
450px|frameless|center
1
10:58, 22 January 2021
Anova model3.png
(
file
)
13 KB
1
09:12, 21 March 2022
Prbdst5.png
(
file
)
13 KB
450px|frameless|center
1
09:06, 21 March 2022
Prbdistribution1.png
(
file
)
13 KB
450px|frameless|center
1
10:59, 22 January 2021
Anova model1.png
(
file
)
15 KB
1
20:19, 20 March 2022
Sankey.png
(
file
)
16 KB
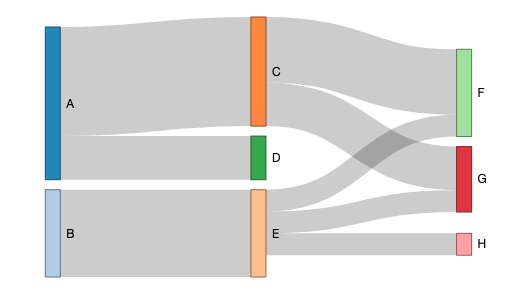
450px|thumb|right|Fig.1: An example of a Sankey diagram.
1
15:55, 24 March 2022
Prbdst12.png
(
file
)
16 KB
450px|frameless|center
1
09:15, 21 March 2022
Prbdst6.png
(
file
)
17 KB
450px|frameless|center
1
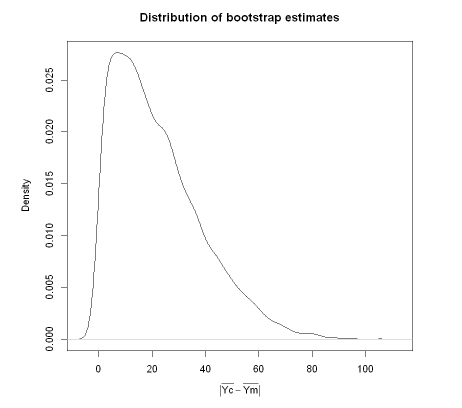
17:36, 25 January 2021
Distribution of bootstrap estimates.png
(
file
)
17 KB
1
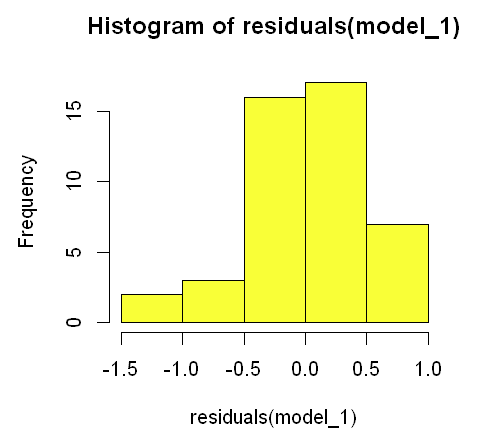
10:47, 22 January 2021
Histogram of residuals(model 1).png
(
file
)
17 KB
1
15:40, 24 March 2022
Prbdst7.png
(
file
)
18 KB
450px|frameless|center
1
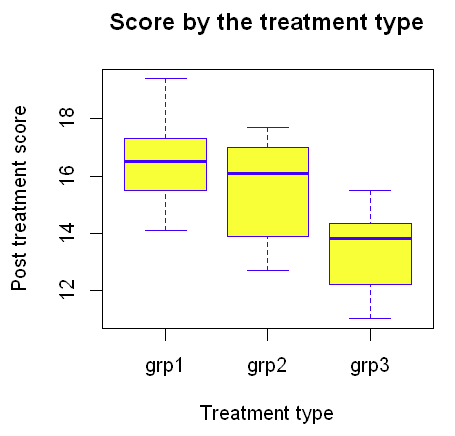
18:22, 19 January 2021
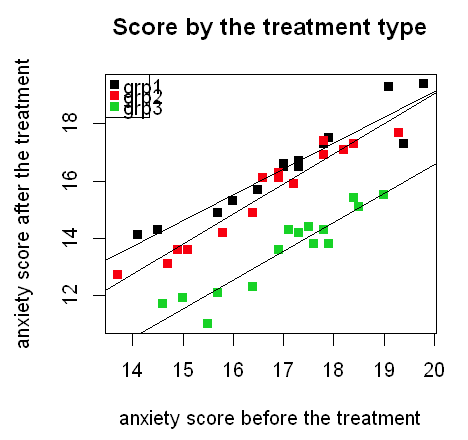
Score by the treatment type.png
(
file
)
18 KB
1
14:44, 22 January 2021
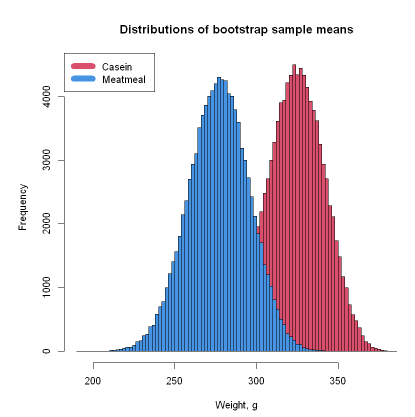
Distributions of bootstrap sample means.png
(
file
)
19 KB
1
10:23, 22 January 2021
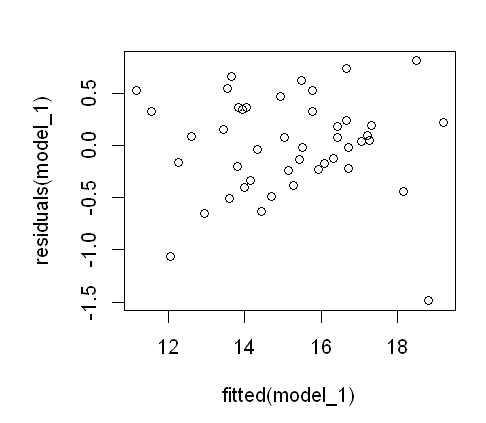
Residuals model.png
(
file
)
19 KB
1
09:05, 21 March 2022
Prbdistribution.png
(
file
)
20 KB
450px|frameless|center
1
15:48, 24 March 2022
Prbdst9.png
(
file
)
20 KB
450px|frameless|center
1
10:55, 22 January 2021
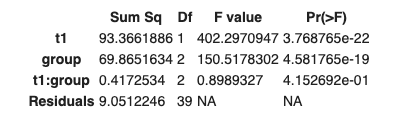
Anova test for model2.png
(
file
)
20 KB
1
17:54, 19 January 2021
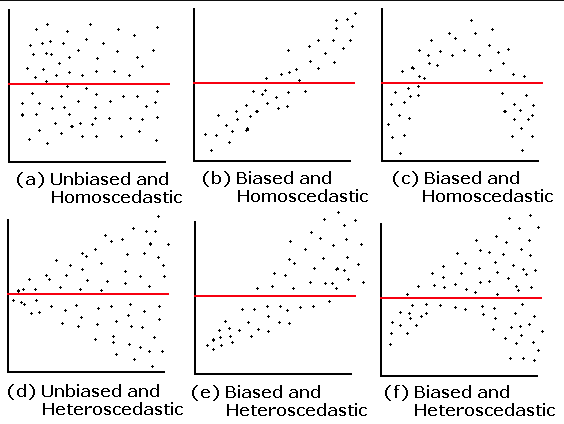
Reading the residuals.png
(
file
)
21 KB
Fig 1. Reading the residuals (Original: condor.depaul.edu/sjost/it223/documents/resid-plots.gif)
200px|thumb|right|alt text
1
08:08, 21 March 2022
Partcorreltns.png
(
file
)
22 KB
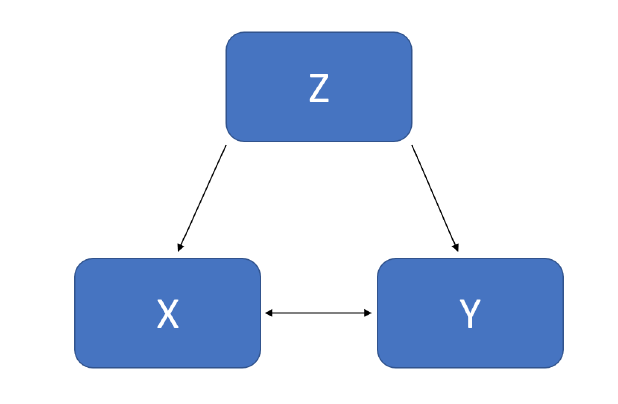
400px|thumb|left|Fig.2: Model of partial correlations.
1
15:46, 24 March 2022
Prbdst8.png
(
file
)
22 KB
450px|frameless|center
1
11:42, 30 May 2021
Customtreemap.png
(
file
)
22 KB
1
15:51, 24 March 2022
Prbdst11.png
(
file
)
23 KB
450px|frameless|center
1
07:48, 17 May 2021
GitLogo.png
(
file
)
23 KB
1
07:47, 17 May 2021
GitHubLogo.png
(
file
)
25 KB
1
15:50, 24 March 2022
Prbdst10.png
(
file
)
25 KB
450px|frameless|center
1
10:14, 22 January 2021
Score by the treatment type2.png
(
file
)
25 KB
1
16:18, 27 April 2021
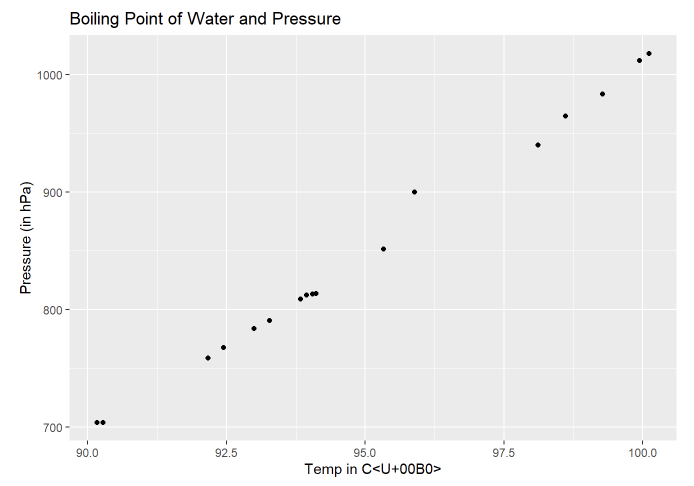
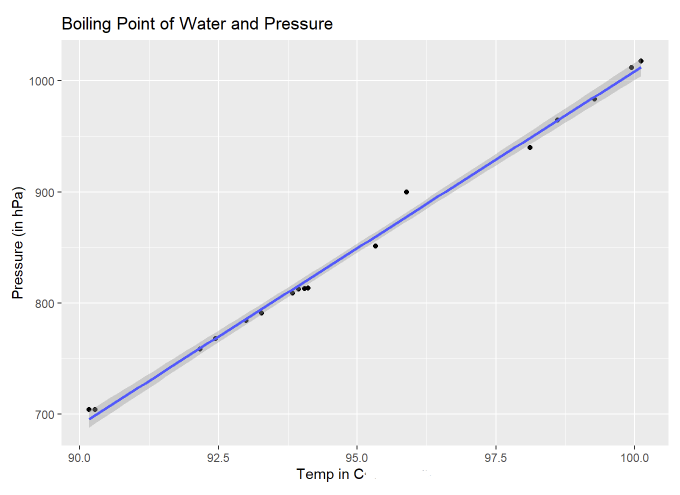
BoilPointWaterP.png
(
file
)
27 KB
1
13:03, 10 February 2021
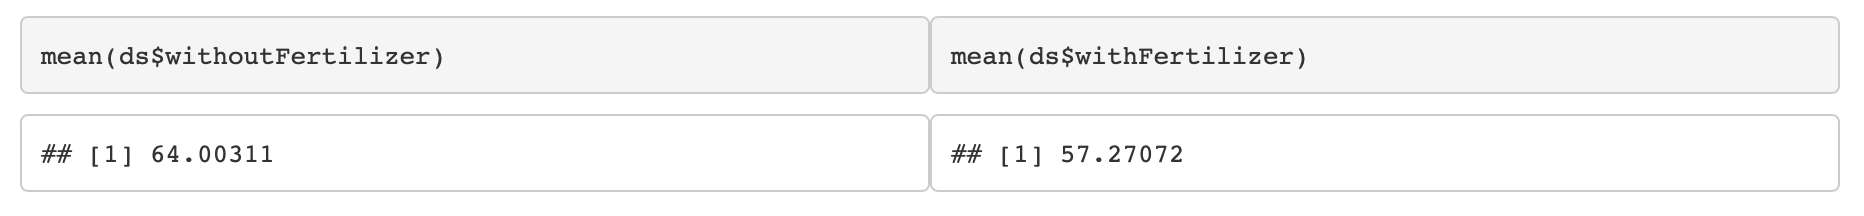
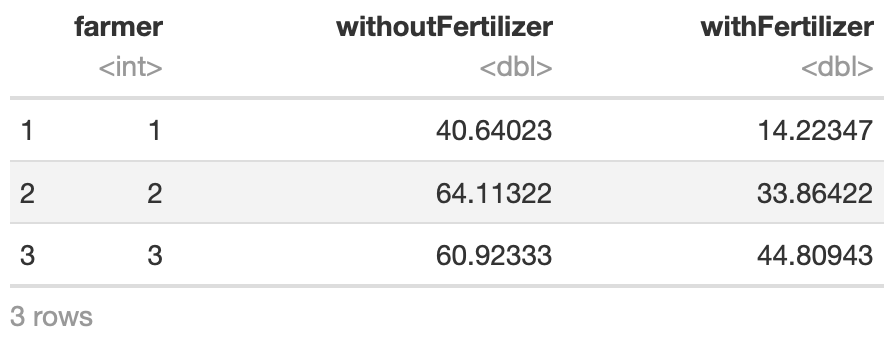
Withwithoutfertiliser.png
(
file
)
29 KB
1
10:47, 29 March 2021
Notchformula.png
(
file
)
29 KB
1
16:25, 27 April 2021
BoilPointWaterP2.png
(
file
)
33 KB
1
20:40, 20 March 2022
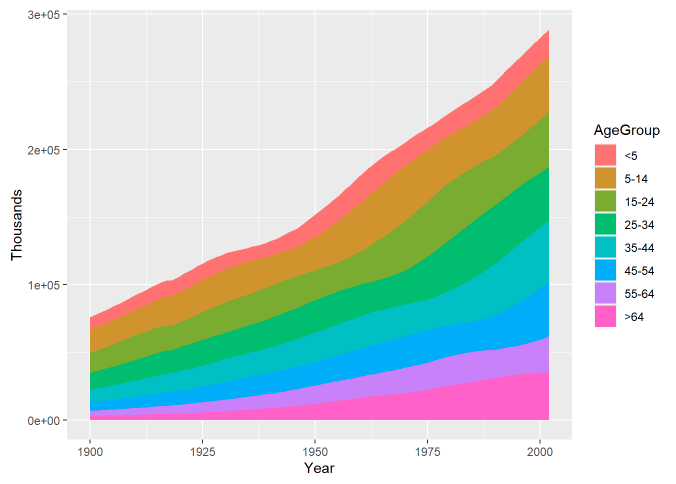
Stckarea.png
(
file
)
34 KB
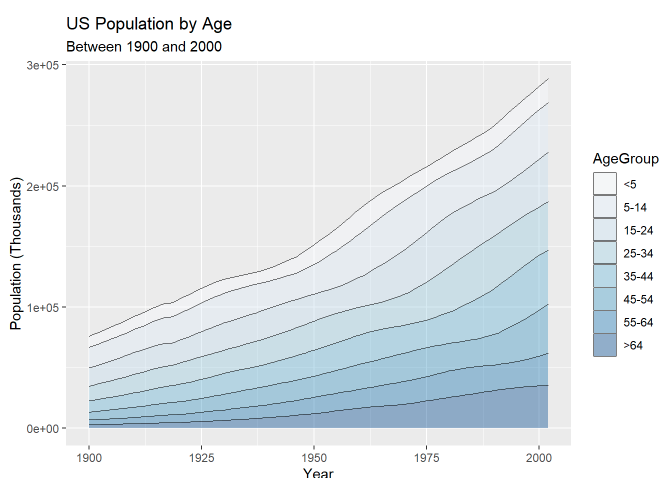
450px|thumb|right|Fig.1: An example of the stacked area plot
1
08:47, 21 March 2022
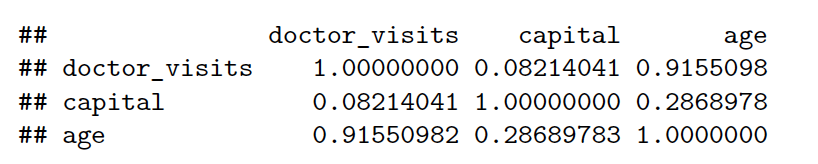
Prtcrl5.png
(
file
)
35 KB
450px|thumb|center|Fig.4: Partial-correlation matrix
1
08:23, 21 March 2022
Prtcrl4.png
(
file
)
35 KB
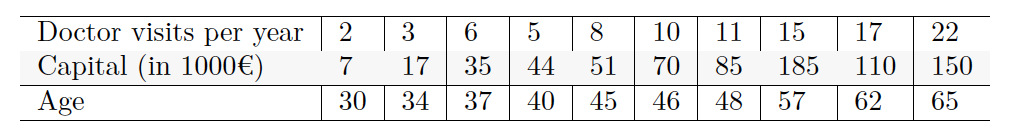
450px|thumb|center|Fig.3: "doctor_visits" data frame.
1
12:56, 10 February 2021
Head3rows.png
(
file
)
36 KB
1
17:47, 25 January 2021
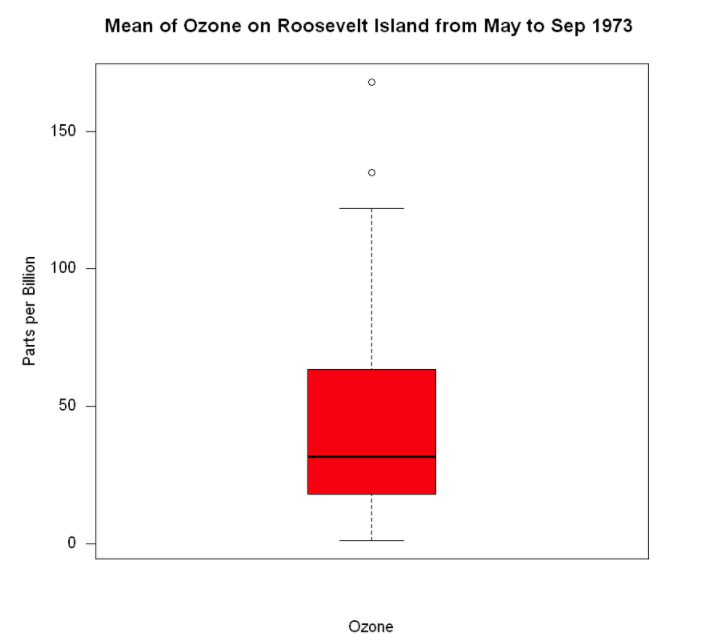
Meanofozoneonrooseveltislandfrommaytosep1973.png
(
file
)
37 KB
1
11:02, 22 January 2021
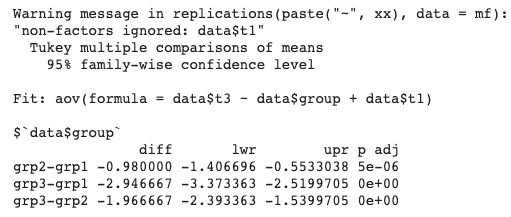
TukeyPostHoc ANCOVA.png
(
file
)
38 KB
1
11:00, 29 March 2021
Boxplotquartiles.png
(
file
)
42 KB
1
19:16, 25 January 2021
Formulas.png
(
file
)
43 KB
1
17:43, 1 March 2021
File 2021-03-01 at 18.42.26.png
(
file
)
43 KB
1
16:41, 29 January 2021
Simple stacked barplot.png
(
file
)
45 KB
1
11:08, 29 March 2021
Notchformula1.png
(
file
)
45 KB
1
20:43, 20 March 2022
Stcharea.png
(
file
)
45 KB
450px|thumb|right|Fig.2: Stacked area plot after customization.
1
09:09, 21 March 2022
Prbdst3.png
(
file
)
50 KB
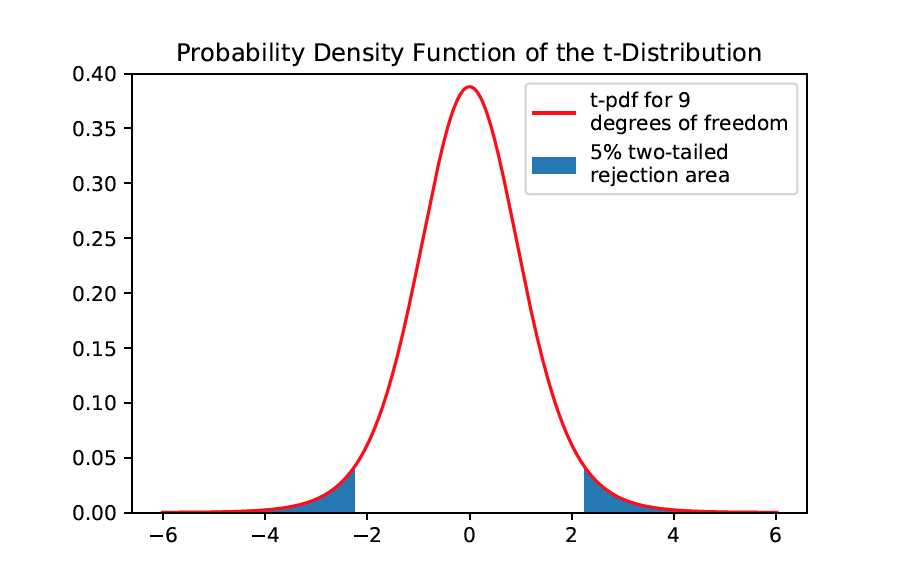
450px|thumb|center|Fig.1: The probability density function of the t-distribution for 9 degrees of freedom. In blue, the 5%, two-tailed rejection region is marked.
1
First page
Previous page
Next page
Last page
Tools
User contributions
Logs
View user groups
Special pages
Printable version


.png)


