Difference between revisions of "File:SCOR Model Visualisation 2.png"
From Sustainability Methods
(No difference)
|
Latest revision as of 13:38, 5 November 2021
A possible visualization of steps 4.5 and 4.6. This shows the interconnectedness and interdependence of multiple subchains and processes within the whole supply chain. The abbreviations are listed in table 2.1 further above. Source: Sürie & Wagner, p. 48
File history
Click on a date/time to view the file as it appeared at that time.
| Date/Time | Thumbnail | Dimensions | User | Comment | |
|---|---|---|---|---|---|
| current | 13:38, 5 November 2021 | 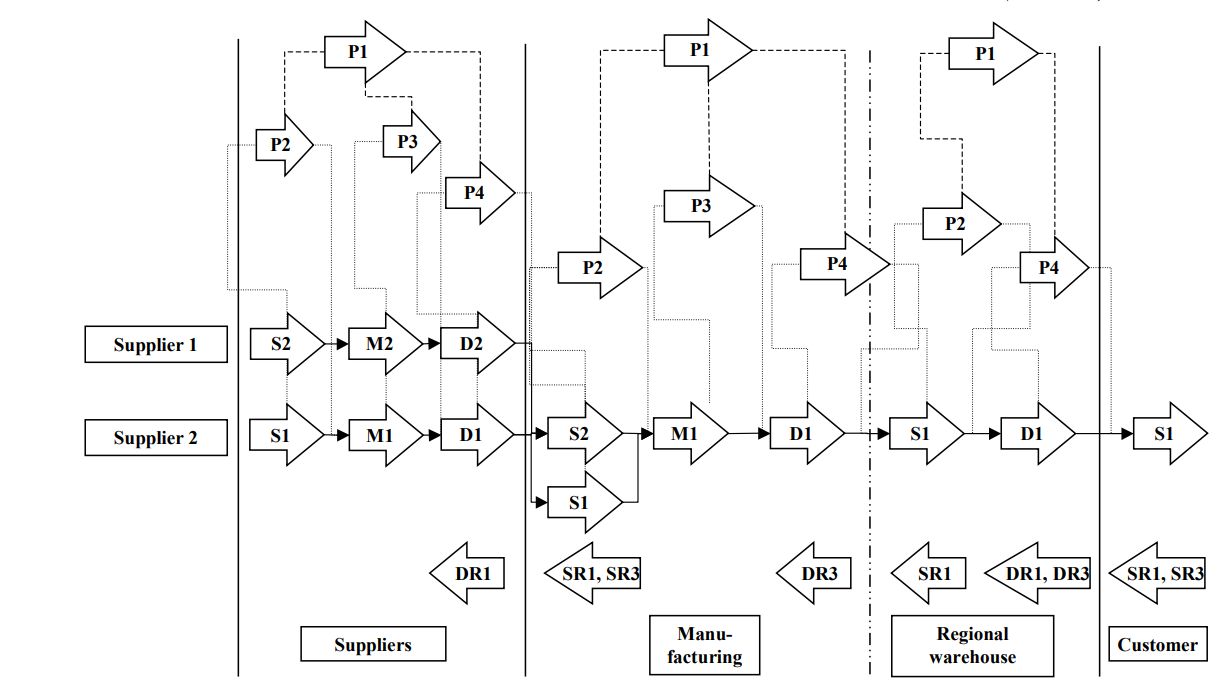 | 1,227 × 698 (121 KB) | Christopher Franz (talk | contribs) |
- You cannot overwrite this file.
File usage
The following page uses this file: