File:Result Visualisation Causal Loop Diagrams.png
From Sustainability Methods
Revision as of 07:22, 28 July 2021 by Christopher Franz (talk | contribs) (Christopher Franz uploaded a new version of File:Result Visualisation Causal Loop Diagrams.png)
Size of this preview: 795 × 600 pixels. Other resolutions: 318 × 240 pixels | 1,143 × 862 pixels.
Original file (1,143 × 862 pixels, file size: 318 KB, MIME type: image/png)
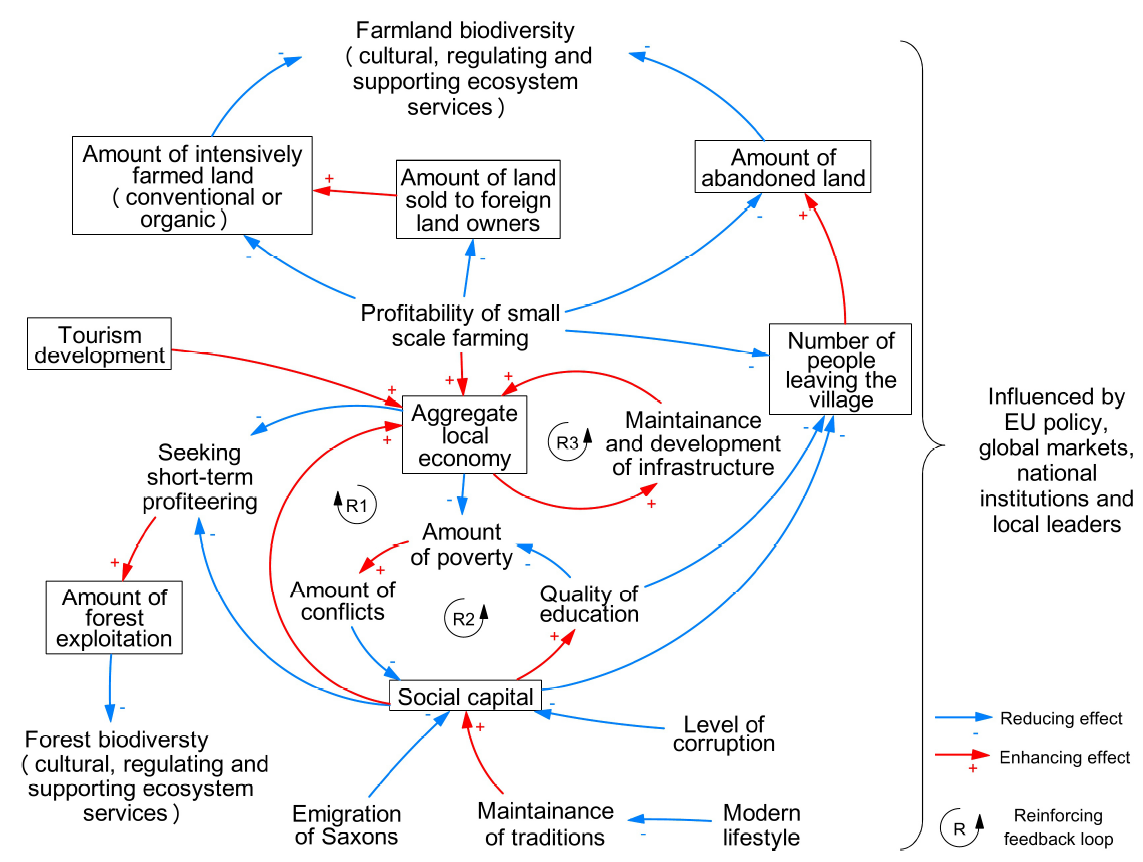
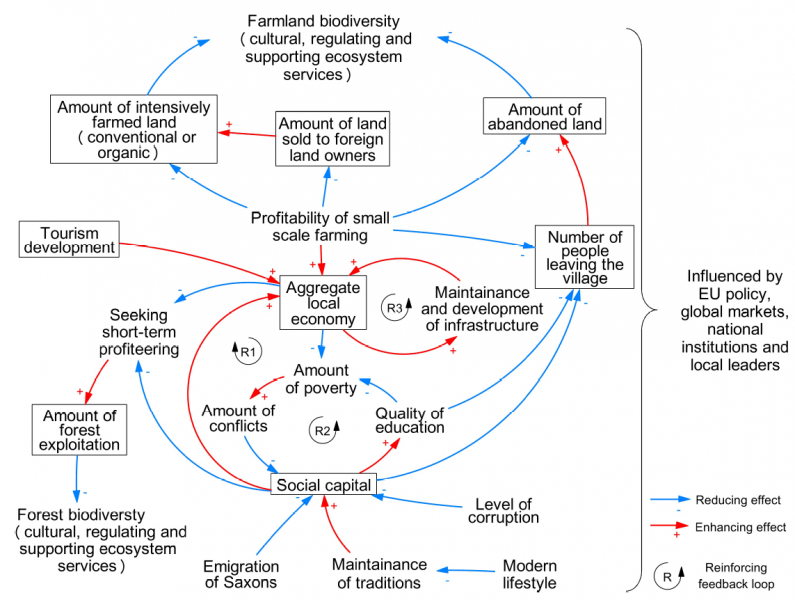
A Causal Loop Diagram illustrating the dynamics of the social-ecological system in a research area in Transylvania. Source: Hanspach et al. 2014. p.5
File history
Click on a date/time to view the file as it appeared at that time.
| Date/Time | Thumbnail | Dimensions | User | Comment | |
|---|---|---|---|---|---|
| current | 07:22, 28 July 2021 | | 1,143 × 862 (318 KB) | Christopher Franz (talk | contribs) | |
| 13:31, 14 September 2020 | 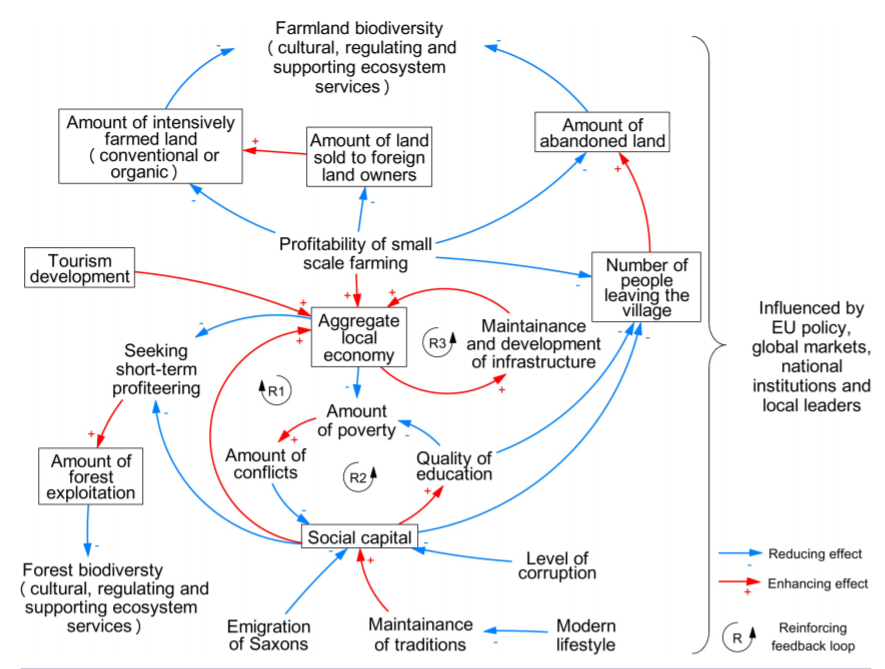 | 885 × 669 (317 KB) | Christopher Franz (talk | contribs) |
- You cannot overwrite this file.
File usage
The following page uses this file: