File:Introduction to Statistical Figures - Ordination example.png
From Sustainability Methods
Size of this preview: 649 × 599 pixels. Other resolutions: 260 × 240 pixels | 734 × 678 pixels.
Original file (734 × 678 pixels, file size: 114 KB, MIME type: image/png)
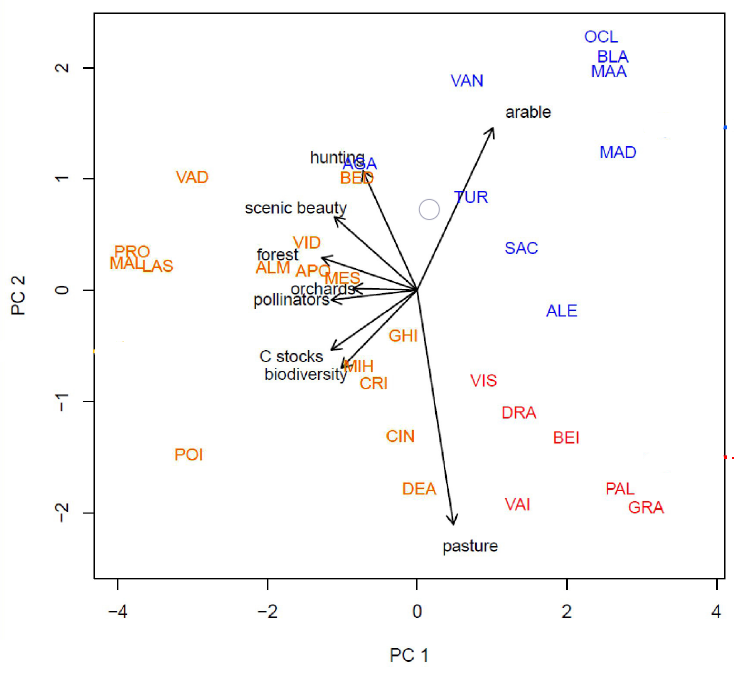
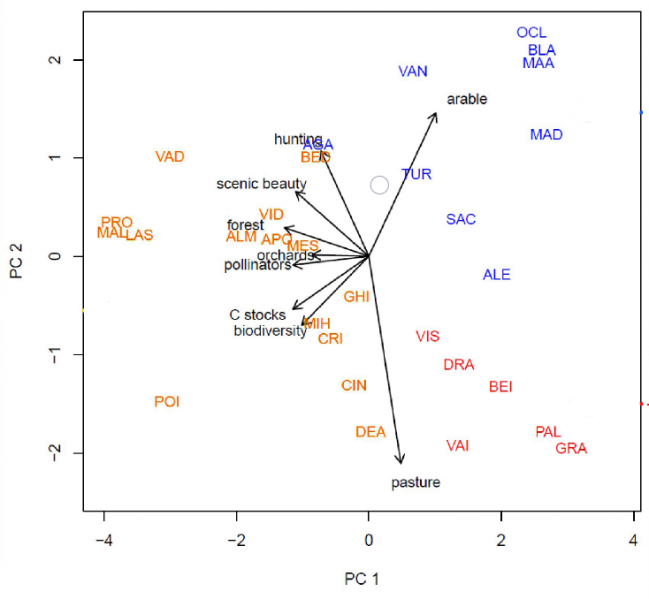
An Ordination plot (Principal Component Analysis) in which analyzed villages (colored abbreviations) in Transylvania are located according to their natural capital assets alongside two main axes, explaining 50% and 18% of the variance. Source: Hanspach et al 2014. A holistic approach to studying social-ecological systems and its application to southern Transylvania.
File history
Click on a date/time to view the file as it appeared at that time.
| Date/Time | Thumbnail | Dimensions | User | Comment | |
|---|---|---|---|---|---|
| current | 09:43, 20 May 2021 | | 734 × 678 (114 KB) | Christopher Franz (talk | contribs) |
- You cannot overwrite this file.
File usage
The following page uses this file: