File:Introduction to Statistical Figures - Bipartite Plot example.png
From Sustainability Methods
Revision as of 09:05, 20 May 2021 by Christopher Franz (talk | contribs)
Size of this preview: 800 × 321 pixels. Other resolutions: 320 × 128 pixels | 1,080 × 433 pixels.
Original file (1,080 × 433 pixels, file size: 167 KB, MIME type: image/png)
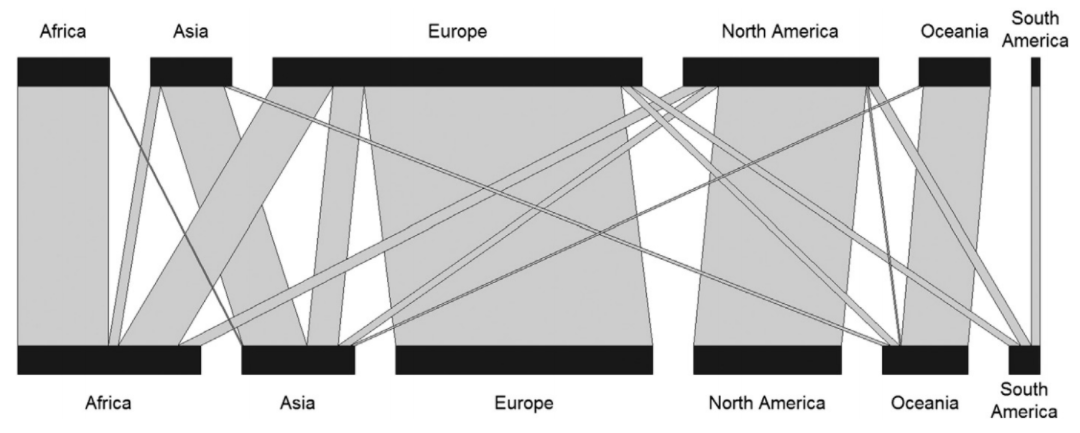
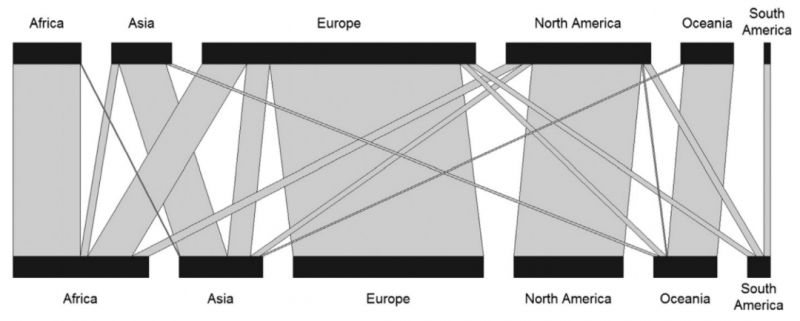
A bipartite plot showing the affiliation of publication authors and the region where a study was conducted. Source: Brandt et al. 2013. A review of transdisciplinary research in sustainability science.
File history
Click on a date/time to view the file as it appeared at that time.
| Date/Time | Thumbnail | Dimensions | User | Comment | |
|---|---|---|---|---|---|
| current | 09:05, 20 May 2021 | 1,080 × 433 (167 KB) | Christopher Franz (talk | contribs) |
- You cannot overwrite this file.
File usage
The following page uses this file: