Concept Maps
| Type | Team Size | ||||||
|---|---|---|---|---|---|---|---|
| Me, Myself and I | Group Collaboration | The Academic System | Software | 1 | 2-10 | 11-30 | 30+ |
What, Why & When
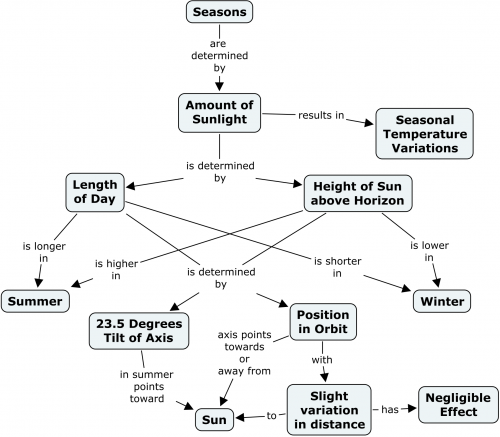
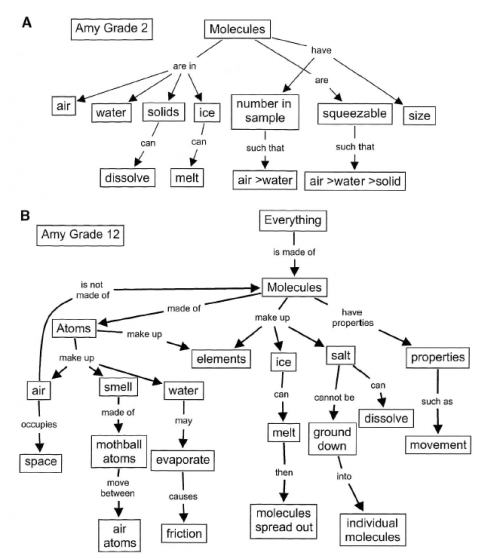
Concept Maps are a form of visually organizing information for groups and individuals. Conceptual terms or short statements are presented in boxes or bubbles and interlinked with other terms through commented arrows, resulting in a hierarchical network-like structure that provides an overview on a topic.
Goals
- Organize conceptual knowledge in a visual form to identify learning processes and knowledge gaps.
- Create new knowledge, ideas and solutions by arranging information in a structured manner around a focus question, topic, or problem.
Getting started

Concept Maps result from the work of Joseph Novak and colleagues at Cornell University in the 1970s in the field of education, and have since been applied in this area and beyond. The original underlying idea was to analyze how children learn, assuming that they do so by assimilating new concepts and positioning these in a cognitive conceptual framework. The idea of Concept Maps emerged from the demand for a form of assessing these conceptual understandings.
Importantly, while Concept Maps are often applied in research, teaching or planning, they should not be confused with the mixed methods approach of Group Concept Mapping. The latter emerged based on Concept Maps in the 1980s, but is a more structured, multi-step process. A Concept Map further differs from a Mindmap in that the latter are spontaneous, unstructured visualisations of ideas and information around one central topic, without a hierarchy or linguistic homogeneity, and do not necessarily include labeled information on how conceptual elements relate to each other.
Concept Maps help identify a current state of knowledge and show gaps within this knowledge, e.g. a lack of understanding on which elements are of importance to a question or topic, and how concepts are interrelated. Identifying these gaps helps fill knowledge gaps. Therefore, they can be a helpful tool for students or anyone learning a new topic to monitor one's own progress and understanding of the topic, and how this changes as learning units continue.
Further, Concept Maps can be a way of approaching a specific question or problem and support a systematic solution-development process. The visual representation of all relevant elements nconcerning a specific topic can thus help create new knowledge. There are even more imaginable purposes of the approach, including management and planning, creative idea-generation and more.

Step by step

- When learning to work with Concept Maps, Novak & Canas (2008) recommend to start with a domain of knowledge that one is familiar with. Here, the learner should focus on a specific focus question and/or text item, activity, or problem to structure the presented elements and hierarchies around, and to contextualize the map by. As the authors highlight, often, "learners tend to deviate from the focus question and build a concept map that may be related to the domain, but which does not answer the question. It is often stated that the first step to learning about something is to ask the right questions".
- After defining the domain of knowledge and focus question or problem, 15-25 key concepts should be identified and ranked according to their specificity. In a concept map, more general, broad concepts are on the top of the map, while more specific concepts are found below, resulting in a hierarchy from top to bottom. So the concepts should be ordered accordingly in a list first.
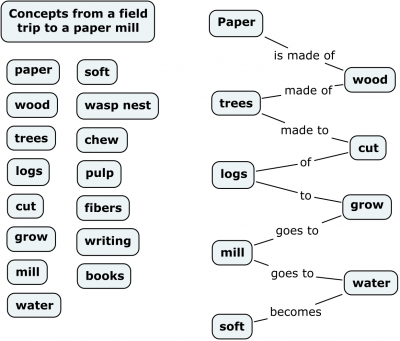
- Then, a preliminary concept map is created, either digitally (with the 'official' IHMC CmapTools software, see below) or by using Post-Its and a whiteboard. Concepts can and should be moved around iteratively. Propositions - connections between concepts with text - are added to the map to highlight and explain relationships between concepts. When a first good draft exists, one identifies cross-links, which are relationships between separate areas of the map, to further highlight conceptual linkages. Lastly, constant revision is applied and concepts can be re-positioned to further improve the map.
Links & Further reading
- This entry was created based on the extensive entry by Novak & Canas (2008), available here. The authors are responsible for the introduction of Concept Maps in the 1970s and the development of the CmapTools.
- Novak, J.D. 2016. The origins of the concept mapping tool and the continuing evolution of the tool. Information Visualisation 5. 175-184.
The author of this entry is Christopher Franz.