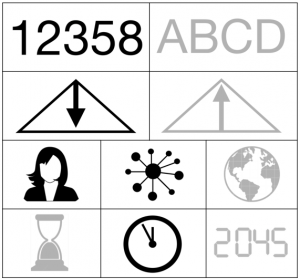
Graphical abstract

Deductive - Inductive
Individual - System - Global
Past - Present - Future
Introduction
Similarly to a written abstract, a graphical abstract of a scientific article is designed to inform the reader about the most relevant results of the article. A graphical abstract is often a single image combining various image objects and text pieces to illustrate and summarize the content and findings of the study at a glance. Graphical abstracts are a recent phenomenon and vary in appearance with the corresponding research field. In chemistry and medicine, graphical abstracts have been common since the 1970s (Ibrahim 2017). Graphical abstracts come in handy to communicate your simplified research findings via social media. The visual language depends on the requirements or general communication of the journal in which the article should be published. Not all research output qualifies for a graphical abstract. A graphical abstract can be part of a thesis.
These research fields mostly use graphical abstracts as queried from web of science with 13.200 articles. Note that the articles where not quality checked and in some “graphical abstract” might appear yet a graphical abstract may not be part of the article.