Uncategorized files
From Sustainability Methods
Showing below up to 50 results in range #101 to #150.
View (previous 50 | next 50) (20 | 50 | 100 | 250 | 500)
- Bildschirmfoto 2020-06-14 um 18.16.39.png 961 × 671; 300 KB
- Bildschirmfoto 2020-06-14 um 19.24.14.png 941 × 558; 931 KB
- Bildschirmfoto 2020-06-14 um 19.34.30.png 800 × 427; 333 KB
- Bildschirmfoto 2020-06-22 um 08.25.14.png 601 × 400; 414 KB
- Bildschirmfoto 2020-06-22 um 08.35.42.png 283 × 183; 28 KB
- Bildschirmfoto 2020-06-22 um 08.46.28.png 362 × 448; 53 KB
- Bildschirmfoto 2020-06-22 um 08.53.11.png 940 × 701; 538 KB
- Bildschirmfoto 2020-06-23 um 16.42.31.png 959 × 627; 624 KB
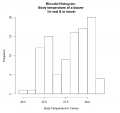
- Bimodalhistrogram.png 794 × 748; 52 KB
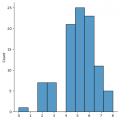
- Bin distr plot 1.png 490 × 490; 8 KB
- Biological determinism.png 342 × 227; 12 KB
- Error creating thumbnail: File with dimensions greater than 12.5 MPBlack-swan.jpg 6,000 × 4,000; 3.06 MB
- Black swan.jpg 1,280 × 853; 227 KB
- Block Experiments.jpg 3,992 × 2,126; 1.5 MB
- BoilPointWaterP.png 694 × 486; 27 KB
- BoilPointWaterP2.png 680 × 495; 33 KB
- Book1.xls ; 25 KB
- Book2.xlsx ; 8 KB
- Bootstr 2example4.png 685 × 374; 19 KB
- Bootstr 2example new.png 682 × 372; 18 KB
- Bootstr 2example new28.png 522 × 372; 15 KB
- Bootstr example1.png 435 × 297; 12 KB
- Bootstr example2 pic3.png 820 × 374; 15 KB
- Bootstr upper quant2.png 469 × 297; 15 KB
- Boxplot.png 356 × 142; 3 KB
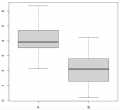
- Boxplot1.png 567 × 397; 9 KB
- Boxplot2.png 1,001 × 353; 13 KB
- Boxplot3.png 1,250 × 1,146; 38 KB
- Boxplot Boxplot Text 2.jpg 508 × 315; 31 KB
- Boxplot inspection.PNG 576 × 571; 33 KB
- Boxplotquartiles.png 836 × 612; 42 KB
- Boxplotswithnwithoutnotches.png 836 × 656; 54 KB
- Bridge.jpg 1,920 × 1,272; 414 KB
- Bubbleplotmtcars.png 1,120 × 676; 74 KB
- Bubplotmtcars.png 1,146 × 694; 84 KB
- CLD 4.png 478 × 490; 32 KB
- COmponents GIS.png 1,280 × 720; 31 KB
- Car Accidents Barplot 2.jpg 545 × 385; 62 KB
- Car Accidents Boxplot 2.jpg 385 × 384; 43 KB
- Car Accidents Histogram 2.jpg 547 × 388; 50 KB
- Caspar David Friedrich - Der Wanderer über dem Nebelmeer.jpg 604 × 768; 122 KB
- Castnetting.png 904 × 600; 1.13 MB
- Catplot1.png 490 × 489; 24 KB
- Catplot2.png 600 × 489; 30 KB
- Causal Loop Delays.png 1,363 × 523; 73 KB
- Causal Loop Diagram - Hard vs Soft.png 880 × 793; 101 KB
- Causal Loop Diagram Visualisation.png 960 × 540; 45 KB
- Causal Loop Example 1.png 321 × 501; 35 KB
- Causal Loop Example 2.png 363 × 520; 37 KB
- Causal Loop Example 3.png 552 × 510; 55 KB


