Designing studies
(The author of this entry is Henrik von Wehrden.)
Contents
Before the experiment
The principle states that one should not make more assumptions than the minimum needed.
Scientific results are:
- Objective
- Reproducible
- Transferable
Sample size
Occam's razor the hell out of it!
The ladder (mean >0 [5], range >1 [5], variance >3 [7], distribution >10 [13], correlation >10 [30])
Population
P-value
In statistical hypothesis testing, the p-value or probability value is the probability of obtaining the test results as extreme as the actual results, assuming that the null hypothesis is correct. In essence, the p-value is the percentage probability the observed results occurred by chance.
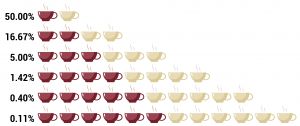
In Fisher's example of a lady tasting tea, a lady claimed to be able to tell whether tea or milk was added first to a cup. Fisher gave her 8 cups, 4 of each variety, in random order. One could then ask what the probability was for her getting the specific number of cups she identified correct, but just by chance. Using the combination formula, where n (total of cups) = 8 and k (cups chosen) = 4, there are 8!/4!(8-4)! = 70 possible combinations. In this scenario, the lady would have a 1.42% chance of correctly guessing the contents of 4 out of 8 cups. If the lady is able to consistently identify the contents of the cups, one could say her results are statistically significant.
Block effects
Insert Block Experiment graphic
