Difference between revisions of "Descriptive statistics"
| Line 1: | Line 1: | ||
__NOTOC__ | __NOTOC__ | ||
| − | |||
[[File:Bildschirmfoto 2020-03-28 um 15.39.37.png|left|thumb|Descriptive Statistics is the most basic things you can do in statistics. Most of you probably also already calculated things like mean and median in school.]] | [[File:Bildschirmfoto 2020-03-28 um 15.39.37.png|left|thumb|Descriptive Statistics is the most basic things you can do in statistics. Most of you probably also already calculated things like mean and median in school.]] | ||
| − | '''Descriptive stats are what most people think stats are all about.''' Many people believe that the simple observation of more or less, or the mere calculation of an average value is what statistics are all about. | + | '''Descriptive stats are what most people think stats are all about.''' Many people believe that the simple observation of ''more'' or ''less'', or the mere calculation of an average value, is what statistics are all about. Of course, this is not the case - statistics is more than descriptive statistics, or whimsical [[Introduction to statistical figures|bar plots or even pie charts]]. Still, knowing the basics is important, so let us have a look. |
| + | |||
| + | == Basics of descriptive statistics == | ||
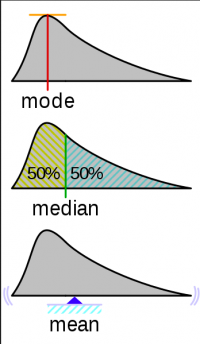
[[File:Bildschirmfoto 2020-03-28 um 15.48.41.png|200px|thumb|right|This graphic visualizes what mean, mode and median explain regarding a dataset.]] | [[File:Bildschirmfoto 2020-03-28 um 15.48.41.png|200px|thumb|right|This graphic visualizes what mean, mode and median explain regarding a dataset.]] | ||
| Line 22: | Line 23: | ||
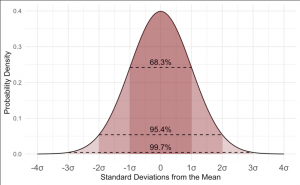
[[File:Bildschirmfoto 2020-03-28 um 15.51.31.png|thumb|right|This graph shows how the standard deviation is spread from the mean.]] | [[File:Bildschirmfoto 2020-03-28 um 15.51.31.png|thumb|right|This graph shows how the standard deviation is spread from the mean.]] | ||
The standard deviation is calculated as the square root of variance by determining the variation between each data point relative to the mean. It is a measure of how spread out your numbers are. If the data points are further from the mean, there is a higher deviation within the data set. The higher the standard deviation, the more spread out the data. | The standard deviation is calculated as the square root of variance by determining the variation between each data point relative to the mean. It is a measure of how spread out your numbers are. If the data points are further from the mean, there is a higher deviation within the data set. The higher the standard deviation, the more spread out the data. | ||
| + | |||
== R examples == | == R examples == | ||
| + | Now, let us have a look at how to calculate these values in R. | ||
<syntaxhighlight lang="R" line> | <syntaxhighlight lang="R" line> | ||
Revision as of 12:37, 29 April 2021
Descriptive stats are what most people think stats are all about. Many people believe that the simple observation of more or less, or the mere calculation of an average value, is what statistics are all about. Of course, this is not the case - statistics is more than descriptive statistics, or whimsical bar plots or even pie charts. Still, knowing the basics is important, so let us have a look.
Basics of descriptive statistics
Mean
The mean is the average of numbers you can simply calculate by adding up all the numbers and then divide them by how many numbers there are in total.
Median
The median is the middle number in a sorted set of numbers. It can be substantially different from the mean value, for instance when you have large gaps or cover wide ranges within your data. Therefore, it is more robust against outliers.
Mode
The mode is the value that appears most often. It can be helpful in large datasets are when you have a lot of repetitions within the dataset.
Range
The range is simply the difference between the lowest and the highest value and consequently it can also be calculated like this.
Standard deviation
The standard deviation is calculated as the square root of variance by determining the variation between each data point relative to the mean. It is a measure of how spread out your numbers are. If the data points are further from the mean, there is a higher deviation within the data set. The higher the standard deviation, the more spread out the data.
R examples
Now, let us have a look at how to calculate these values in R.
#descriptive statistics using the Swiss dataset
swiss
swiss_data<-swiss

#we are choosing the column fertility for this example
#let's begin with calculating the mean
mean(swiss_data$Fertility)

#median
median(swiss_data$Fertility)

#range
range(swiss_data$Fertility)

#standard deviation
sd(swiss_data$Fertility)

#summary - includes minimum, maximum, mean, median, 1st & 3rd Quartile
summary(swiss_data$Fertility)
External Links
Videos
- Descriptive Statistics: A whole video series about descriptive statistics from the Khan academy
- Standard Deviation: A brief explanation
- Mode, Median, Mean, Range & Standard Deviation: A good summary
Articles
- Descriptive Statistics: An introduction
- Descriptive Statistics: A detailed summary


