Difference between revisions of "To Rule And To Measure"
m (→Introduction) |
m (→Introduction) |
||
| Line 10: | Line 10: | ||
The same can be said for tools that enable the translation of physical or social phenomena into such units: some, like a ruler, are very much related to physical properties, while others, such as [https://journals.sagepub.com/doi/abs/10.1177/0959354302012003012 IQ tests], are based on so many assumptions about how intelligence should or could be measured, that there is no denying strong normative implications. There is no judgement to be made here, but one should be aware of the fact that units of measurement may imply specific assumptions about the world and how much we can know about it. There are things we can measure, things we could measure (but do not necessarily align with the measurement's ideas), and things we cannot measure at all. '''Hence, we should remember that these numbers are not only not objective, but also normative.''' | The same can be said for tools that enable the translation of physical or social phenomena into such units: some, like a ruler, are very much related to physical properties, while others, such as [https://journals.sagepub.com/doi/abs/10.1177/0959354302012003012 IQ tests], are based on so many assumptions about how intelligence should or could be measured, that there is no denying strong normative implications. There is no judgement to be made here, but one should be aware of the fact that units of measurement may imply specific assumptions about the world and how much we can know about it. There are things we can measure, things we could measure (but do not necessarily align with the measurement's ideas), and things we cannot measure at all. '''Hence, we should remember that these numbers are not only not objective, but also normative.''' | ||
| − | '''The following entry provides examples on units of measurement and tools to measure.''' There will be more additions over time. All of these represent major breakthroughs and have consolidated over time. All these diverse data formats and tools should strengthen our understanding that we look at parts of the picture. The emergence of new measures does not only unlock new knowledge, it also highlights the limitations of our total knowledge. As [[Bias and Critical Thinking|critical realism]] claims, we may never be able to fully understand all aspects of all mechanisms of reality that are real. For instance, many institutions are riddled by [Glossary|tacit knowledge] that we only now start to slowly unlock. We thus have to acknowledge that the examples given here have limitations, and that there are many forms of knowledge that cannot be tamed or constructed into numbers. | + | '''The following entry provides examples on units of measurement and tools to measure.''' There will be more additions over time. All of these represent major breakthroughs and have consolidated over time. All these diverse data formats and tools should strengthen our understanding that we look at parts of the picture. The emergence of new measures does not only unlock new knowledge, it also highlights the limitations of our total knowledge. As [[Bias and Critical Thinking|critical realism]] claims, we may never be able to fully understand all aspects of all mechanisms of reality that are real. For instance, many institutions are riddled by [[Glossary|tacit knowledge]] that we only now start to slowly unlock. We thus have to acknowledge that the examples given here have limitations, and that there are many forms of knowledge that cannot be tamed or constructed into numbers. |
Please refer to the [https://sustainabilitymethods.org/index.php/Data_formats entry on Data formats] for more general information on how data can be formatted. | Please refer to the [https://sustainabilitymethods.org/index.php/Data_formats entry on Data formats] for more general information on how data can be formatted. | ||
Revision as of 12:14, 7 November 2023
Note: The German version of this entry can be found here: To Rule And To Measure (German).
In short: This entry illustrates different types of data units and approaches to measuring our world.
Contents
Introduction
Throughout history, humans have developed myriads of tools and units that help measure, categorize, compare, analyze and understand things, processes and people - in short, the world. We have measured space and time, sound and light, the movement of atoms and molecules, and there is no end in sight. You use measurements every day - stepping onto the weighing scale in the morning (don't do that!), calculating the time you need to get to university, the amount of sugar you need for the cake, or the money you spent last weekend. You may even (unconsciously) reflect on the amount of fun different potential activities might be, or think about your level of satisfaction with your last meal.
Some units of measurement are very strongly connected to the physical world, such as measuring weights or lengths, despite the existence of different units to do so. Others are very much socially constructed, such as the Human Development Index (HDI), which puts a number to the whole quality of life. And then, there is a wide range in between, like the Beaufort scale which does measure something physical (wind), but is quite a somewhat arbitrary form of doing so.
The same can be said for tools that enable the translation of physical or social phenomena into such units: some, like a ruler, are very much related to physical properties, while others, such as IQ tests, are based on so many assumptions about how intelligence should or could be measured, that there is no denying strong normative implications. There is no judgement to be made here, but one should be aware of the fact that units of measurement may imply specific assumptions about the world and how much we can know about it. There are things we can measure, things we could measure (but do not necessarily align with the measurement's ideas), and things we cannot measure at all. Hence, we should remember that these numbers are not only not objective, but also normative.
The following entry provides examples on units of measurement and tools to measure. There will be more additions over time. All of these represent major breakthroughs and have consolidated over time. All these diverse data formats and tools should strengthen our understanding that we look at parts of the picture. The emergence of new measures does not only unlock new knowledge, it also highlights the limitations of our total knowledge. As critical realism claims, we may never be able to fully understand all aspects of all mechanisms of reality that are real. For instance, many institutions are riddled by tacit knowledge that we only now start to slowly unlock. We thus have to acknowledge that the examples given here have limitations, and that there are many forms of knowledge that cannot be tamed or constructed into numbers.
Please refer to the entry on Data formats for more general information on how data can be formatted.
Examples of constructed scales for data
Celsius vs Fahrenheit vs Kelvin
Celsius, Fahrenheit and Kelvin represent the most common temperature scales used today. While Celsius is used in most places in the world, the USA and associated territories still use the Fahrenheit scale. Kelvin is based directly on Celsius and is most commonly used by scientists to communicate their results (e.g. when speaking about a temperature increase of 2K), but not really used in everyday practice in any country.
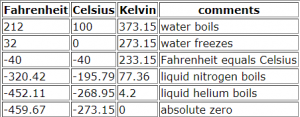
In Celsius, water freezes at (~) 0°C and boils at (~) 100°C. -273,15°C represents the lowest possible temperature a gas can (theoretically) reach, and can be translated into 0 Kelvin. Kelvin is thus always 273,15 higher than Celsius. The unit of Fahrenheit is based on a thermometer using a mixture of water, ice and ammonium chloride - the minimum temperature that could be reached with this mixture was set as 0°F. Fahrenheit can be translated into Celsius as follows: °F = (°C)x(9/5) + 32
Richter Scale
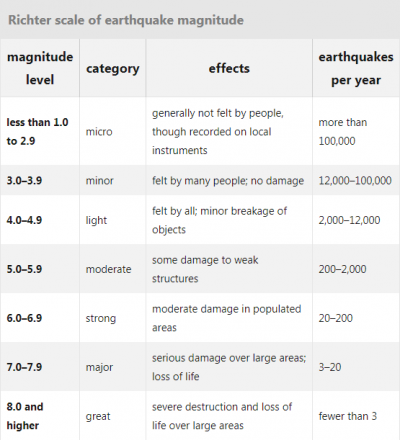
The Richter Scale is used to measure the strength of earthquakes. It was developed in 1935 by US American seismologists Richter and Gutenberg. It is based on the logarithm of the amplitude of the largest seismic wave of an earthquake event. Each increase of one unit on the scale signifies a tenfold increase in the magnitude of an earthquake, and a 31 times higher amount of energy released. While today's technologies can measure seismic waves below what was possible with the Richter scale, and are better to measure very strong earthquakes, the Richter scale is still often used, especially in the media.
Beaufort scale
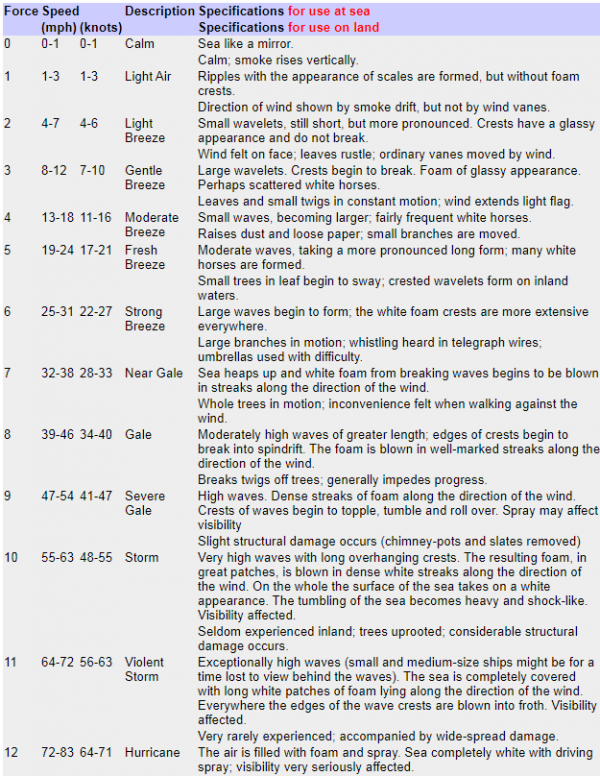
The Beaufort Wind Scale was created by British Admiral Sir Francis Beaufort in 1805. It allows to assess the speed of winds based on their effects on both land and oceans. It goes from 0 to 12, with 12 being the strongest winds.
Decibel
Decibel (dB), as well as Bel (1 Bel = 10dB) are dimensionless physical units that refer to the relation between two measurements (measured and reference) on a logarithmic scale. They were first publicized in 1931 and are still used in various fields of application; however, dB still most commonly referred to when speaking about the loudness of sounds. However, it is important to note that dB does not indicate the absolute loudness of something, but only the logarithmic (not linear!) relation to a reference point, which, for sound, is the point where the human ear can no longer perceive any sound.
For this usage, some examples include:
- 20dB - soft whispering
- 50dB - normal conversation
- 110dB - rock concert
- 140dB - rifle shot
- 190dB - deadly loudness
Happiness
Measuring the well-being of people and progress thereof has been subject of debates for a long time. While GDP is the most widespread approach to measure human (presumable) well-being on a nation-wide or global level, there is an increasing demand for alternative indicators. One of those under discussion is happiness, with Bhutan being the first and so far only country to prioritize 'Gross National Happiness' in their decisions.
Happiness - being a very subjective unit of measurement - is difficult to evaluate. The 'World Happiness Report' attempts to do so over 200 pages. It has been published regularly since 2013 and uses representative, self-reported data from (mostly) the Gallup World Poll. Here, participants answer questions about over a 100 aspects of life, including their average life evaluation on a scale from 1-10. The World Happiness Report, then, tries to understand how different aspects of life explain variations in this self-reported life evaluation. In the 2020 report, for example, they focus on how the elements GDP, social support, life expectancy, freedom to make life choices, generosity and perception of corruption influence it. Other elements that are analyzed are inequality, worry and anger, discrimination, income, trust in society, systems and the policy, intimacy and many others. Overall, the report states Finland, Denmark and Switzerland to be the countries with the happiest people (on average), while Zimbabwe, South Sudan and Afghanistan mark the bottom three. You can find out more about this report on the respective website.
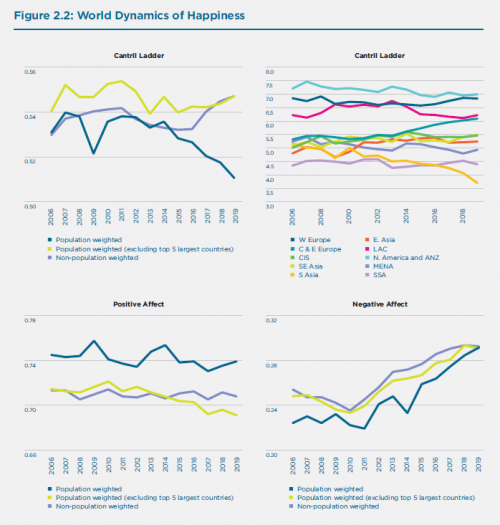
The image shows the average global happiness between 2017 and 2019. Life evaluation is measured by the Cantril ladder question that asks respondents to evaluate the quality of their lives on an 11-point ladder scale, with the bottom step of the ladder (0) being the worst possible life they can imagine and the highest step (10) being the best possible life. Positive affect is measured by a two-item index asking respondents whether or not they frequently experienced (1) enjoyment and (2) laughter on the day before the survey. Negative affect is measured by a three-item index asking respondents whether they frequently experienced (1) worry, (2) sadness, and (3) anger on the day before the survey.
IQ
IQ, short for intelligence quotient, is a common metric to indicate and compare human intelligence. There is no standard definition of intelligence and a variety of normalized IQ tests exist. The respective chosen version needs to be considered when speaking about the IQ value itself. Generally, an IQ test covers questions from different fields, including general logical understanding, understanding of language, general knowledge, mathematical skills and others. After conducting an IQ test, each participant receives a numeric value to indicate his or her intelligence.
The average result is defined to be 100, with a standard deviation of 15. Because of demographic changes (age, education...), IQ test norms have to be updated regularly. This was not done in the 20th century, leading to ever-increasing average IQ values, which has been called the Flynn effect and cannot be explained. Commonly, anyone with an IQ <70 is considered witless, while anyone with >130 is considered highly talented. Importantly however, there is severe scientific criticism concerning the IQ, since a person's results to an IQ test are very dependent on his or her daily form, and the test does not cover all relevant aspects of intelligence. Also, the societal discourse around the IQ is problematic since it might lead to wrong assumptions and inferences about people's abilities and value.
HDI
The Human Development Index (HDI) is an index published by the United Nations since 1990. It calculates a value between 0 and 1 based on three aspects of life: life expectancy at birth, quality of education as measured in the number of years a person visits school, and income per capita. Each country can reach a value between 0 and 1, with 1 being the best possible result. In the 2019 report, the countries with the highest HDI were Norway, Switzerland and Ireland which all reached values above 0,94, whereas the bottom was marked by Chad, the Central African Republic and Niger.
The HDI is a fairly simple measure, focusing only on those three elements. There is also the IHDI, which acknowledges and and respects inequalities within these criteria (with the same top and bottom three). The 2019 report revolved around inequalilties within and across nations, indicating an increasing recognition of more integrated evaluation of the HDI. For equality, the GINI coefficient is also of relevance, indicating financial (in)equality within a nation - for more on this, see here.
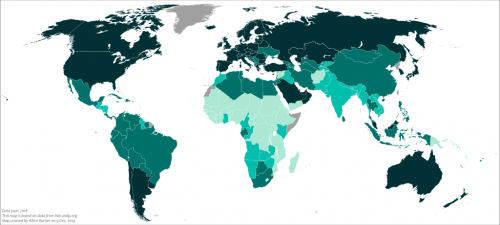
United States customary units vs the Metric System
To this day, the United States (as well as Liberia and Myanmar) use a system of measurements (the USC) that differentiates from the Metric System that the majority of countries use. The USC is based on English units and was formalized in 1832, whereas Britain went on to use the Imperial and later the Metric system. The US rejected any metric system, stating that these were not 'acceptable to the Lord'. In 1975, the Metric Conversion Act made the common Metric System the preferred system for trade and commerce, and it is the standard in, among other sectors, science and military, but the USC is still commonly used in everyday practice in the US, especially in consumer products and industrial manufacturing. Some examples include:
- Lenght and area:
- 1 inch = 2,54cm
- 1 foot = 30,48cm
- 1 yard = 91,44cm
- 1 mile = 1,609344 km
- 1 acre = 4046,873 m²
- Mass and weight:
- 1 ounce = 28,35g
- 1 pound = 453,59g
The weight of the soul (21 grams)
In 1907, physician Duncan MacDougall attempted to prove the existence of the human soul - scientifically. He chose six individuals which were about to die and placed them on a precise scale. The moment they died, he claimed in the publication of his results, they lost 21 grams in body weight, which were not explainable by any other processes other than the test subjects losing their soul as they died. Naturally, there was criticism to this study, and other explanations were raised. However, the idea that the human soul weighs 21 grams - and therefore exists - has been popularized and even influenced movie director Alejandro González Iñárritu, who named a 2003 movie just that: "21 Grams". To this day, the experiment raises the question what science can, and cannot, know.
Examples of tools to measure data
Knots for depth of water
Depth sounding is a method to measure the depth of water. It was already applied in Ancient Greece and Rome, and still finds use for hobby fishing and as a backup for today's standard echo sounding in case of malfunction. In Depth Sounding (which has nothing to do with 'sound' as in 'noise'), a thin rope is combined with a plummet, i.e. a weight, that hangs at the end of it. This rope is then dropped into the water until it reaches the ground surface. By looking at marks made at the rope, one can quickly measure the depth of the water. Interestingly, the author Mark Twain got his artist's name from this technique. In Depth Sounding, the depth of the water can be indicated by saying "By the mark" and adding the number that is met by the water surface. In Mississippi in the 1850s, the number 'two' would be called 'twain', so when the leadsmen measured the depth of the river and it was two fathoms (one fathom is 1,8288m), they would say "by the mark twain".
Thermometer
A Thermometer is based on the fact that liquids (and gases) expand and contract depending on the temperature. While the first steps towards modern thermometers were made in Ancient Greece and later again during the 16th and 17th century, major breakthroughs were the thermometers invented by Fahrenheit in 1714 and Celsius in 1742 (see Celsius vs. Fahrenheit vs. Kelvin). There have been different scales, units and liquids (or gases) used in thermometers throughout time; today, most classic thermometers rely on mercury, and despite the differences in measuring units, there is an internationally agreed range of temperatures to be displayed by a thermometer.
Sextant
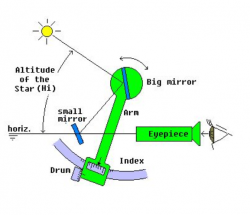
A Sextant is a nautical tool to identify a ship's position. It is based on measuring the angular distance between astronomical objects and was invented by Newton and Hadley around 1700. A Sextant consists of a circular sector with a mirror, a half-mirror and a telescope. One looks at one specific point (at a star, the sun or the horizon) through the telescope and moves the mirror until a second reference point is reflected onto the half-mirror, which makes the objects ultimately overlap. Based on the movement of the mirror, one can read off the angle on the scale of the sextant. The angle between a star above the horizon, in combination with the time of day, helps identify the geographical latitude with the help of astronomical tables. The angle between the moon and a star leads to the geographical altitude.
Geodetic measurement - Trigonometry
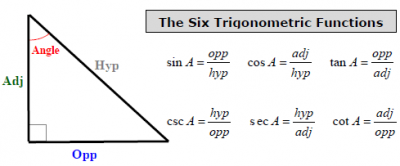
Trigonometry is one of the oldest forms of calculating and measuring, with its origins spanning across Sumer, Babylon, Greece, Egypt, India and other early civilizations up until 4000 years ago. The word means "triangle measuring" and refers to the usage of side lenghts and angles of triangles for calculations. By knowing the sizes of enough sides and angles of a triangle, it is possible to calculate the size or length of the remaining sides and angles. Trigonometry has been used historically in geodetic measurements, astronomy, navigation and many other fields of application, allowing for the development of many relevant technologies and inventions throughout history.
While trigonometry can become quite elaborate, the most basic planar trigonometry as we know it today is based on the work of Rheticus and his student Otho in the 16th Century, and includes six fundamental trigonometric functions: sinus, cosinus, tangens, as well as cosecant, secant and cotangent. By knowing two variables of the triangle, the third can be calculated with the use of a calculator, or historically with a table book or slide rule.
LiDAR
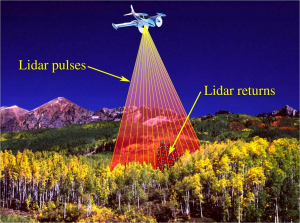
LiDAR is short for "light detection and ranging". It is a technology that measures the distance between LiDAR sensor and any object in its visible range. LiDAR can be applied in plane or satellite based measuring, as well as near the surface. The sensor sends out a light impulse with a laser and detects the light that is reflected from each object. Based on the time the light needed, it calculates the distance to the object. The objects may be solid, but can also be liquid or even gaseous. This way, the LiDAR sensor is able to construct a 3D image of, for example, the earth's atmosphere or surface. LiDAR technology can help create maps and has recently be used to identify aerosols in the air, temperature profiles or trace gas concentrations.
Chinese counting with fingers
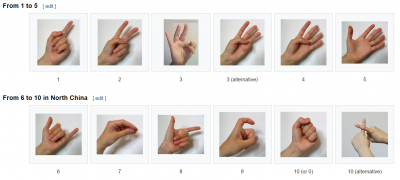
In China, there is a system to indicate the numbers from 1-10 with only one hand (as opposed to the Western custom of indicating one unit per finger, thus only reaching five per hand). This system probably emerged because of the Chinese language variety, or also because of a wish to convey information privately.
The Ruler
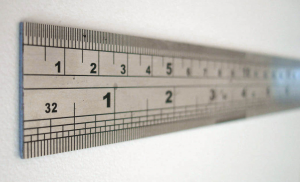
Rulers, also referred to as 'line gauges', are the archetype of measuring tools. They help identify the distance between points or the length of lines (which is the same, if you think about it), or can be used as an geometrical aid to determine whether a line is straight or bent, and to draw straight lines when necessary. Rulers are commonly made of wood, plastic, steel, flexible tape or such, depending on the field of application, user preference and necessary length. The latter can differ: ancient rulers had varying lengths, rulers that can be encountered in school typically measure 30 cm in length, and more flexible (sometimes foldable) rulers used in architecture, construction or other such fields often measure several meters. Historically, rulers were more commonly applied once the metric system (see above) was popularized from the late 18th Century on. However, the oldest preserved ruler (made of copper-alloy) dates back to 2650 BC at Nippur, Sumer, and rulers from Ivory were used in the Indus Valley before 1500 BC.
Space Telescope
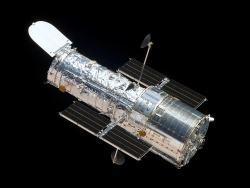
A Space Telescope is a telescope in outer space. Different from satellites that image the earth, it points into outer space in order to map or survey distant stars, planets and other astronomical objects. Space observations have the benefit not to be affected by filtering and distortions through earth's atmosphere as well as light pollution on earth. Therefore, they enable scientists to better observe space despite the difficulties to maintain and high costs to build space telescopes.
Gas and Liquid Chromatography
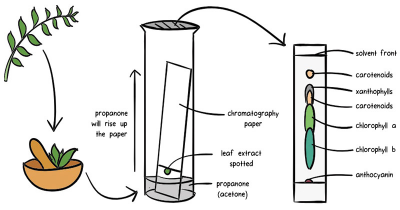
Gas Chromatography (GC) and Liquid Chromatography (LC) are the two main forms of Chromatography, which describes an analysis technique used to quantify compounds in a mixture, for example in quality control in industrial contexts, in forensics, or in environmental sciences. The term 'Chromatography' was coined by Russian botanist Tswett in 1906, whereas the method itself was first used in 1952.
A Chromatography has two main components: a stationary phase, and a mobile phase which moves along the medium within the Chromatograph. For Gas Chromatography, the mobile phase consists of an inert gas, like helium or nitrogen, while the stationary phase consists of a liquid. For Liquid Chromatography, the mobile phase is a liquid and the stationary phase is solid. The sample that is to be analyzed is inserted into these phases. Those compounds that interact more strongly with the stationary phase ("like-dissolves-like" rule, i.e. chemically similar compounds stay together) remain in this phase for a longer time, while those compounds that interact less with the stationary phase move with the mobile phase. The distribution of compounds inbetween both phases can be analyzed using different forms of detectors, leading to insights about the composition of the initial sample.
Concluding remarks
Many of these measures are often defined by researchers as scientific methods. We would disagree, because these measures do not create knowledge in itself, yet are often an important basis for data gathering and the structuring of the gathered knowledge. We have to acknowledge that there is a wealth of data available, and the here-presented examples showcase the great diversity that highlight the challenge to integrate different data. This will be one of the main methodological challenges of the 21st century, and underlines both the importance of the recognition of qualitative methods as well as the deep normativity that is part of the diverse datasets that we have.
Sources and additional information
- Celcius, Kelvin & Fahrenheit: https://cryo.gsfc.nasa.gov/introduction/temp_scales.html
- Richter Scale: britannica.com/science/Richter-scale
- Beaufort Scale: weather.gov./mfl/beaufort
- Decibel: https://www.elektronik-kompendium.de/sites/grd/0304011.htm, https://de.wikipedia.org/wiki/Bel_(Einheit)
- IQ: https://flexikon.doccheck.com/de/Intelligenzquotient, https://de.wikipedia.org/wiki/Intelligenzquotient, https://www.iqmindware.com/wiki/what-does-my-iq-score-mean, https://www.youtube.com/watch?v=7p2a9B35Xn0 (Answering the question if the IQ really measures how smart you are), https://www.youtube.com/watch?v=7p2a9B35Xn0 (a critical reflection)
- HDI: https://en.wikipedia.org/wiki/Human_Development_Index, http://hdr.undp.org/en/2019-report
- HDI, GDP and the GINI index: https://www.investopedia.com/terms/g/gdp.asp, https://www.factmonster.com/math-science/weights-measures/metric-weights-and-measures (Reflecting upon different measurement systems across the globe), http://hdr.undp.org/en/content/human-development-index-hdi (an alternative to the GDP), https://www.investopedia.com/terms/g/gini-index.asp (measuring inequality)
- US customary units vs. metric system: https://en.wikipedia.org/wiki/United_States_customary_units, Martin Gardner (May 4, 2012). Fads and Fallacies in the Name of Science. Courier Corporation. pp. 180–. ISBN 978-0-486-13162-7. (quote on the metric system's acceptance)
- Weight of the soul: https://www.thevintagenews.com/2018/11/30/21-grams-experiment/
- Knots for depth of water: https://en.wikipedia.org/wiki/Depth_sounding
- Thermometer: https://en.wikipedia.org/wiki/Thermometer
- Sextant: https://www.brighthubengineering.com/seafaring/31615-marine-navigational-equipment-the-sextant/, https://www.spektrum.de/lexikon/physik/sextant/13240
- Trigonometry: https://math.wikia.org/wiki/History_of_trigonometry
- LiDAR: https://www.dlr.de/rd/desktopdefault.aspx/tabid-5626/9178_read-17527/
- Finger counting: https://en.wikipedia.org/wiki/Chinese_number_gestures
- Ruler: https://en.wikipedia.org/wiki/Ruler
- Space telescope: https://en.wikipedia.org/wiki/Space_telescope
- Chromatography: http://www.chem.ucla.edu/~bacher/General/30BL/gc/theory.html, https://microbenotes.com/chromatography-principle-types-and-applications/
The authors of this entry are Christopher Franz and Henrik von Wehrden.
