Difference between revisions of "Descriptive statistics"
From Sustainability Methods
(→Videos) |
|||
| Line 24: | Line 24: | ||
[https://www.youtube.com/watch?v=h8EYEJ32oQ8&list=PLU5aQXLWR3_yYS0ZYRA-5g5YSSYLNZ6Mc Descriptive Statistics]: A whole video series about descriptive statistics from the Khan academy | [https://www.youtube.com/watch?v=h8EYEJ32oQ8&list=PLU5aQXLWR3_yYS0ZYRA-5g5YSSYLNZ6Mc Descriptive Statistics]: A whole video series about descriptive statistics from the Khan academy | ||
| + | |||
| + | [https://www.youtube.com/watch?v=MRqtXL2WX2M Standard Deviation]: A brief explanation | ||
| + | |||
| + | [https://www.youtube.com/watch?v=mk8tOD0t8M0 Mode, Median, Mean, Range & Standard Deviation]: A good summary | ||
=='''Articles'''== | =='''Articles'''== | ||
Revision as of 14:59, 28 March 2020
Descriptive statistics
Descriptive stats are what most people think stats are all about. Many people believe that the simple observation of more or less, or the mere calculation of an average value is what statistics are all about. The media often shows us such descriptive statistics in whimsical bar plots or even pie charts.
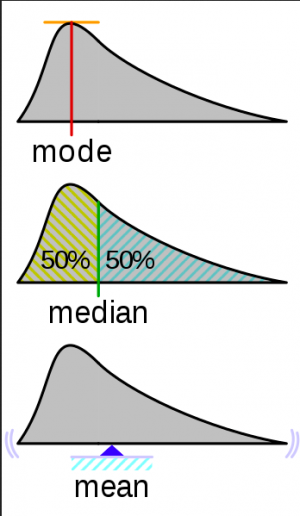
Mean
Median
Mode
Range
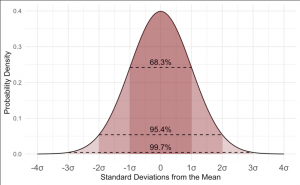
Standard deviation
External Links
Videos
Descriptive Statistics: A whole video series about descriptive statistics from the Khan academy
Standard Deviation: A brief explanation
Mode, Median, Mean, Range & Standard Deviation: A good summary


