Difference between revisions of "Bias in statistics"
| Line 1: | Line 1: | ||
| + | '''Note:''' This entry revolves around Bias in statistics. For more general thoughts on Bias, please refer to the entry on [[Bias and Critical Thinking]]. | ||
| + | __TOC__ | ||
| + | |||
==Defining bias== | ==Defining bias== | ||
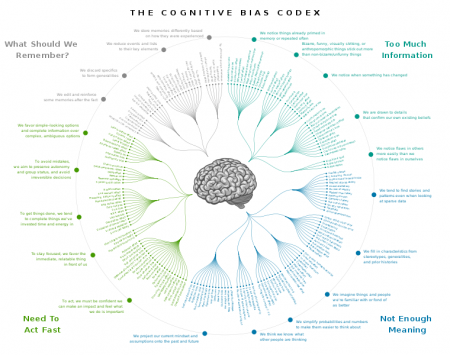
[[File:Cognitive Bias 2.png|450px|thumb|right|'''A world of biases.''' For an amazing overview and the whole graphic in detail, go to '''[https://upload.wikimedia.org/wikipedia/commons/6/65/Cognitive_bias_codex_en.svg Wikipedia]''']] | [[File:Cognitive Bias 2.png|450px|thumb|right|'''A world of biases.''' For an amazing overview and the whole graphic in detail, go to '''[https://upload.wikimedia.org/wikipedia/commons/6/65/Cognitive_bias_codex_en.svg Wikipedia]''']] | ||
Revision as of 07:10, 26 March 2021
Note: This entry revolves around Bias in statistics. For more general thoughts on Bias, please refer to the entry on Bias and Critical Thinking.
Contents
Defining bias

A bias is “the action of supporting or opposing a particular person or thing in an unfair way, because of allowing personal opinions to influence your judgment”. In other words, bias cloud our judgment and often action in a sense, that we act wrong. We are all biased, because we are individuals with individual experience, and are unconnected from other individuals and/or groups, or at least think we are unconnected.
Consequences of bias

If our actions are biased, mistakes happen and the world becomes more unfair or less objective. We are all biased. Therefore, we need to learn of consciously reflect our biases if at all possible. Biases are abundantly investigated and discussed both in science and society. However, we only start to understand the complex mechanism behind the diverse sets of biases, and how to cope with the different biases. In statistics, there are some biases that are more important than others. In addition, statistics are a method that is often used to quantify many biases. Statistics are thus prone to bias, but at the same time can be helpful to investigate biases. This is rooted in the fact that any statistics can only be as good as the person that applies it. If you have a strong bias in your worldview, statistics may amplify this, but statistics can also help you to understand some biases better. The number of biases becomes almost uncountable, highlighting an increasing recognition of where we are biased and how this can be potentially explained. Let us look at the different steps that we have in a study that builds on the use of statistics to focus on the biases that are relevant here. Let us start with an overview on biases.
Bias in statistical sampling
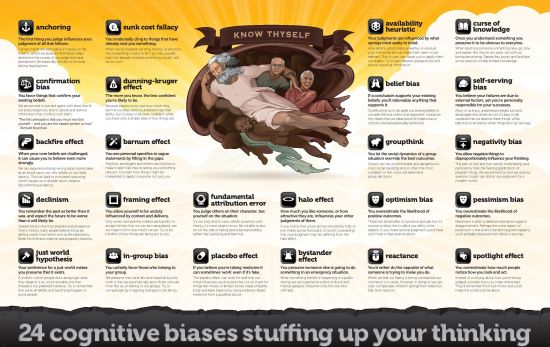
There are a lot of biases. Within statistics sample bias and selection bias are among the most common problems that occur. Starting with the sampling of data we might have a distorted view of reality through selection bias hence we might only sample data because we are aware of it, thereby ignoring other data points that lack our recognition. In other words, we are anchoring our very design and sampling already in our previous knowledge. Another prominent bias features the diversity of groups. We tend to create groups as constructs, and our worldview - among many other things - creates a bias in this creation of constructs. One bias that I just have to mention because I think it's so fantastic is the Dunning Kruger effect. This bias highlights the tendency of some unskilled individuals to overestimate their competence and abilities. Dunning Kruger folks tend to think they are the best when they are actually the worst. Why do I highlight this while talking about statistics? I witnessed quite some people that already destroyed their dataset with their initial sample design, however they consider themselves among the greatest statisticians of all time and advertised their design as the crowning achievement of our civilisation. While conducting an observation as part of our sampling we might have fallen under the observer bias, thereby influencing our data subconsciously for instance by favoring one group in our sampling. We might have already observed a misrepresentation of the total sample through a selection bias, where we favored certain groups in our selection of our sample, and not by how we observed them. Even hypothesis building might be influenced by a congruence bias, if researchers only test for their hypothesis directly but not for possible alternative hypotheses. To this end you can also add a confirmation bias for good measure, where researchers only confirm their expectations again and again and again by building on the same statistical design and analysis.
Bias in analyzing data
Scientists are notoriously prone to another bias, the hindsight bias, which highlights the omnipotence of scientists in general, who are quite sure of themselves when it comes to analyzing their data. Furthermore the IKEA effect might underline how brilliant our analysis is, since we designed the whole study by ourselves. While we conduct an experiment we might have an observer expectancy effect thereby influencing our study by manipulating the experiment to generate the effects we were expecting after all. The analysis of data is often much like an automation bias. Most researcherss rely on the same statistics again and again. But not to worry: we might have had a selection bias both in our sampling as well as our selective analysis of the data after all, which may be corrected our results without us knowing that thanks to the positivity effect. Through framing we might overestimate single samples within our dataset, and often our initial design as well as the final interpretation of our analysis can be explained by such framing, where we rely on single anecdotes or unrepresentative parts of our data.
Interpretation bias
Confirmation bias is definitely the first bias that comes to mind. But if our results are radical and new they might be ignored or rejected, due to the "Semmelweis reflex", which states that new discoveries are always wrong. Based on our results, we may make a forecast bias, for instance if we use our results to predict beyond the statistical power of our data. Scientist often conduct a self-serving bias by interpreting their analysis in a positivistic sense, thereby arriving at a result that supports their grand theory. And now we come to the really relevant biases, namely culturalism, sexism, lookism, racism and – do I have to name more? When interpreting our results we do this through our subjective lense, and our personal identity is a puzzle of our upbringing, our heritage, the group(s) we consider we belong to, our social and cultural norms and many many more factors that influence our interpretation of our data and analysis.
A world beyond Bias?
So now that we heard some examples about biases, what does this all mean? First of all there is ample research about biases. There is a huge knowledge database from the scientific community that can help us understand where a bias might occur and how it affects us. Psychology, sociology and cultural studies are to name when it comes to the systematic investigation of biases in people. But there is more. A new forefront of researchers that try to investigate novel, non-violent and reflexive settings where we can try to to minimize our biases. New group interaction formats emerge, and research settings are slowly changing to a bold attempt of a research community that is more aware of their biases. Often these movements are at the outer fringe margins of science, and mix up with new age flavors and self-help driven improvers. Still, it is quite notable that such changes are slowly starting to emerge. Never before was more knowledge available to more people at greater speed. We might want to take it slow these days and focus on what connects us instead of becoming all accelerated but widely biased individuals.
Furthermore, it can of course be interesting to investigate a bias as researchers. Biases can help us as they open a world of normativity in our brains. It is quite fascinating to build on theory e.g. from psychology and focus on one specific bias in order to understand how we can tackle these issues. There are other systematic approaches we can deal with biases. Let us break it down into several steps. First of all there are biases that tinker with our worldview. These biases are relevant as science can build on theories in order to derive hypotheses or generate specific research questions. Therefore it is necessary as scientists to be aware of the fact that we have a limited worldview and that for cultural gender or societal reasons among many other factors our view of the world is biased. This is in itself not problematic as long as we are aware of the fact our scientific knowledge production process is limited to our hemisphere, our culture or specific aspects, like our scientific discipline. Bias can help us to understand our limitations and errors in judgment as scientists better. We may never be best, but we may thrive for it.
Bias in scientific studies
Reporting biases in studies that utilise statistics can be roughly sorted into two groups: Biases that are at least indirectly related to statistics, and biases that are widely unrelated to statistics as these are correctly utilised in the study. The first groups is the one we focus on in this text, and the second group is what we basically need to focus on and become hopefully more conscious about during the rest of our life.
As part of the first group we can consider that whenever we report everything we made in the study in a transparent way, then even if our result are influenced by some sort of bias, then at least our results should be reproducible or the very least, other researchers may be able to understand that we conducted our study in a way that inferred a bias. This happens all the time, and it is often a matter of experience whether we are aware of a bias. Still, some simple basics can also be taught regarding statistics that may help us to report information to understand a bias, and then there are even some ways to minimise a bias.
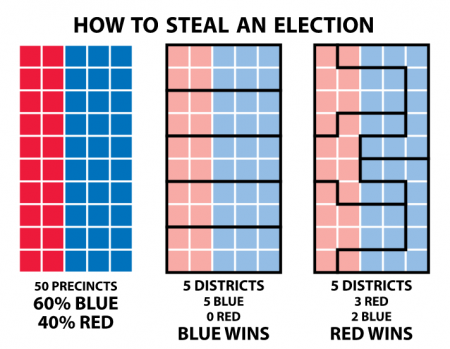
Sample size as part of the design, as well as sample selection are the first steps to minimise sampling bias. Stratified designs may ensure a more representative sampling, as we often tend to make deliberate samples that inflict a certain bias. Being very systematic in your sampling may thus help to tame a sampling bias. Another example of a bias associated to sampling is a geographical bias. Things that are close to each other are more similar than things that are distant from each other. The same can be true for people regarding some of their characteristics. Segregation is a complex phenomenon that would lead to a biased sample if we want to interview people in a city and then only interview participants from one neighbourhood. Gerrymandering is an example of a utilisation of this knowledge, often to influence election results or conduct other feeble minded manipulation of administrative borders. Hence before we sample we need to ask ourselves how we might conduct a sample bias.
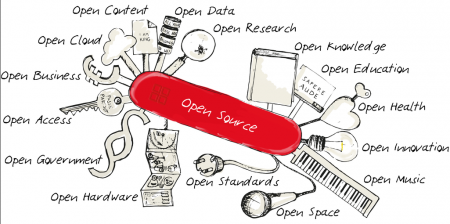
The second bias in statistics is the analysis bias. Here, we should be aware that it can be beneficial to contact a statistician in order to inquiry which model would be best for our data. We need to apply the most parsimonious model, yet also should report all results in a most unbiased and thus most reproducible fashion. Quite often one is able to publish details about the analysis in the online appendix of a paper. While this makes the work often more reproducible, I am sorry to report that in the past it also led to some colleagues utilising the data and analysing it only partly or wrong, hence effectively making a scientific misconduct. While this happens rarely, I highlight it for the simple reason to raise awareness that with all the open source hype we currently face, we did not think this through, I believe. Quite often people use data then without being aware of the context, escalating to wrong analysis and even bad science. Establishing standards for open source is a continuous challenge, yet there are good examples out there to highlight that we are on a good way. We need to find reporting schemes that enable reproducibility, which might then enable us detect bias in the future, when more data, better analysis or new concepts might have become available, thereby evolving past results further. Reporting all necessary information on the result of a software or a statistical test or model is one essential step towards this goal. How good is a model fit? How significant is the reuse? How complex is the model? All these values are inevitable to put the results into a broader context of the statistics canon.
Some disciplines tend to add disclaimers to the interruption of results, and in some fields of science it is considered as good scientific practice to write about the limitations of the study. While this is in theory a good idea, these fields of science devalue their studies by adding such a section generically. I would argue, that if such a section is added every time, it should be added never, since it is totally generic. Everyone with a firm understanding of statistics as well as theory of science knows that studies help to approximate facts, and future insights might lead to different and more often to more precise results. More data might reveal even different patterns, and everyone experienced in statistics knows how much trust can be put into results that are borderline significant, or that are based in small or unrepresentative samples. This should be highlighted if it is really an issues, which I consider to be good scientific practice. If it is highlighted every time, people will not pay the necessary attention to it in the long run.

Hence I urge you to be transparent in showing your design. Be experienced in the analysis you choose, or consult experts, and evaluate your results in the context of the statistical validity, sampling and analysis. Hardly ever are disciplinary border more tangible as in the reporting of bias. While some fields such as medicine are following very established and conservative -in a good sense- standards, other disciplines are dogmatic, and even other excel through omission of bias reporting. Only if the mechanical details and recognitions of bias within statistics become reported in a reasonable and established fashion we will be able to contribute more to the more complex bias that we face as well. Racial bias, gender bias as well as privilege are constant reminders of a vast challenge we all face, and where we did not start to glimpse the tip of the iceberg. Statistics needs to get a grip on bias across different disciplines, otherwise we infer more variance into science, which diminishes the possibility to start engaging in debates into the more serious social, racial, cultural and other biases that we are facing every day.
External Links
Articles
What is bias?: An introduction
A World of Biases: For broad overview
The Idols of the Mind: Were some sort the first categorisation of biases
Bias in Statistics: An overview
Selection Bias: An introduction with many examples
The Dunning-Kruger Effect: An explanation
Congruence Bias: An introduction
Hindsight Bias: Some helpful explanations from the field of economics
IKEA effect: A research paper about the boundary conditions, examined in 3 experiments
The Positivity Effect: A very short definition
Confirmation Bias: A short but insightful article
The Psychology of Bias: A really good paper with many real life examples
The Semmelweis reflex: Why the effect has been named after Semmelweis becomes apparent by looking at his biography
The Conditions of Intuitive Expertise: This article of Kahneman and Klein investigates whether expert's intuitive estimations are valuable or prone to biases
Overcoming biases: Some advice to apply in your daily life
Wrong Sample Size Bias: Some words on the importance of sample size
Geographical Bias: An interesting article about bias and college application
Gerrymandering: An example of segregation from the US
Limitations of the Study: A guideline
Videos
Sampling Methods and Bias within Surveys: A very interesting video with many vivid examples
Semmelweisreflex by Fatoni: Looking at bias from another perspective
Stratified Sampling: Techniques for random sampling and avoiding bias
The author of this entry is Henrik von Wehrden.


