Difference between revisions of "Geographical Information Systems"
| (34 intermediate revisions by 6 users not shown) | |||
| Line 1: | Line 1: | ||
| − | [[File: | + | [[File:Quan_dedu_indu_indi_syst_glob_past_pres_futu.png|thumb|right|[[Design Criteria of Methods|Method Categorisation:]]<br> |
| − | + | '''Quantitative''' - Qualitative<br> | |
| − | <br | + | '''Deductive''' - '''Inductive'''<br> |
| − | + | '''Individual''' - '''System''' - '''Global'''<br> | |
| − | + | '''Past''' - '''Present''' - '''Future''']] | |
| − | |||
| − | |||
| − | |||
| − | |||
| − | |||
| − | |||
| − | |||
| − | |||
| − | |||
| − | |||
| − | |||
| − | |||
'''In short:''' Geographical information systems (GIS) subsume all approaches that serve as a data platform and analysis tools for spatial data. | '''In short:''' Geographical information systems (GIS) subsume all approaches that serve as a data platform and analysis tools for spatial data. | ||
| Line 23: | Line 11: | ||
At this time, topographic maps were already perfected as part of the Nation States creating inventories and understandings of their territories, and also of their colonies and their wealth. Topographic maps were increasingly able to depict different layers of information, as maps were printed in different colours that all represented different kinds of information, such as vegetation, thematic information, water, and more. With the [[History_of_Methods#Internet_and_Computers_-_The_New_Science_Of_Interconnectedness|rise of the computer age]], this information was implemented into computers, and Canada created the first digital Geographical Information System in the 1960. This highlights how [[Glossary|innovation]] of Geographical Information Systems was strongly driven by application, since such systems are of direct benefit in planning and governance. The main driver of innovation in early GIS development was however [http://apogeospatial.com/the-enduring-legacy-of-howard-fisher/ Howard T. Fisher] from Harvard, who - with his team - developed important cornerstones that still serve as a basis for GIS, including different data formats and the general architecture of GIS systems. '''First commercial systems started to thrive in the 1970s and 1980s, yet only with the rise of personal computers and the Internet, Geographical Information Systems unleashed their full potential.''' | At this time, topographic maps were already perfected as part of the Nation States creating inventories and understandings of their territories, and also of their colonies and their wealth. Topographic maps were increasingly able to depict different layers of information, as maps were printed in different colours that all represented different kinds of information, such as vegetation, thematic information, water, and more. With the [[History_of_Methods#Internet_and_Computers_-_The_New_Science_Of_Interconnectedness|rise of the computer age]], this information was implemented into computers, and Canada created the first digital Geographical Information System in the 1960. This highlights how [[Glossary|innovation]] of Geographical Information Systems was strongly driven by application, since such systems are of direct benefit in planning and governance. The main driver of innovation in early GIS development was however [http://apogeospatial.com/the-enduring-legacy-of-howard-fisher/ Howard T. Fisher] from Harvard, who - with his team - developed important cornerstones that still serve as a basis for GIS, including different data formats and the general architecture of GIS systems. '''First commercial systems started to thrive in the 1970s and 1980s, yet only with the rise of personal computers and the Internet, Geographical Information Systems unleashed their full potential.''' | ||
| − | While simple vector formats were already widely used in the 1990s and even before, the development of a faster bandwidth and computer power proved essential to foster the exchange and usage of satellite data. While much of this data (NOAA, LANDSAT) can be traced back to the | + | While simple vector formats were already widely used in the 1990s and even before, the development of a faster bandwidth and computer power proved essential to foster the exchange and usage of satellite data. While much of this data (NOAA, LANDSAT) can be traced back to the 1970s, it was the computer age that made this data widely available to the common user. Thanks to the 'Freedom of Information Act', much of the US-based data was quickly becoming available to the whole world, for instance through the University of Maryland and the NASA. The development of GPS systems that originated in military systems allowed for a solution to spatial referencing and location across the whole globe. Today, commercial units from around the millennium are implemented in almost every smartphone in a much smaller version. This wide establishment allows for the location of not only our technical gadgets, but also goods and transportation machines. An initial NASA system showed a strong resemblance to Google Earth in the early 2000s, and with the commercial launch of Google Earth and Google Maps, the tech giant built a spatial database that is to date almost unrivalled. |
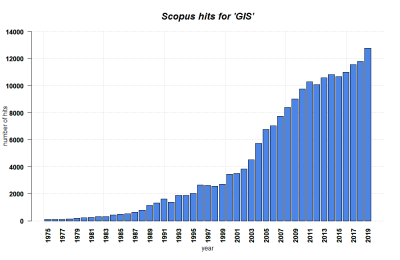
[[File:GIS Scopus.png|400px|thumb|right|'''SCOPUS hits per year for GIS until 2019.''' Search term: 'GIS' in Title, Abstract, Keywords. Source: own.]] | [[File:GIS Scopus.png|400px|thumb|right|'''SCOPUS hits per year for GIS until 2019.''' Search term: 'GIS' in Title, Abstract, Keywords. Source: own.]] | ||
| Line 30: | Line 18: | ||
| − | + | '''What is GIS?''' | |
| − | ''' | ||
| − | + | With the rise of computers the processing, usage and analysis of spatial data has been playing a key role across all facets of our societies. Within science, diverse fields such as geography, spatial science, data science and many other fields have harnessed the use of information technology to access information sources and to integrate the processing, analysis and interpretation of spatial data. This development continuously unleashed new potential in how we observe, communicate, and evaluate the spatial patterns, processes and mechanisms that utilize but equally drive the internet and computerization. Within geographical information systems, a generalisation of the world is saved within diverse data formats, ultimately deriving a coarse version that represents the respective spatial phenomena. | |
| − | Geographical | + | Geographical information systems -or short GIS- are computer systems for managing, analysing, and displaying data related to positions and geographic information. GIS can show many kinds of data on one map. A GIS facilitates diverse ways to visualize, analyse, and understand spatial patterns and processes. Since much of the data we utilize can be spatially referenced by a coordinate system, GIS data can be facilitated to analyse such spatially referenced information. For example, if we want to know about the number of students participating in different lectures taking place at Leuphana, a simple table cross-referenced with the respective lecture halls might suffice. Yet in order to enable a spatial representation of the location the students within those lecture halls, a geographical visualization is required. |
| + | Illustration of this example? | ||
| − | + | There are diverse definitions available for geographic information system, e.g. | |
| − | |||
| − | |||
| − | + | “GIS is an integrated system of computer hardware, software, and trained personnel linking topographic, demographic, utility, facility, image and other resource data that is geographically referenced. -------NASA | |
| − | |||
| − | |||
| − | |||
| − | + | “In the strictest sense, a GIS is a computer system capable of assembling, storing, manipulating, and displaying geographically referenced information, i.e. data identified according to their locations. Practitioners also regard the total GIS as including operating personnel and the data that go into the system.” -------USGS | |
| − | + | “A geographic information system (GIS) is a computer-based tool for mapping and analysing things that exist and events that happen on earth. GIS technology integrates common database operations such as query and statistical analysis with the unique visualization and geographic analysis benefits offered by maps.” -------ESRI | |
| − | + | Examples of Applications of GIS: | |
| − | + | GIS operate on various levels and typically serve multiple functions. The most basic level to operate GIS is cartography, which is commonly used to map making. GIS can also be used for spatial data analysis. | |
| − | + | a. GIS Cartography | |
| + | Maps are an integral part of human development, and many cultures have utilized maps as crucial tools to navigate, explore, describe and explain. Early maps were essentially an attempt on story telling of distant voyages by cartographers. Cartographers performed the role of artists by creating images based on traveller knowledge, memories, and concerns. With the rise of mathematics, particularly trigonometrics, and the development of technology, maps evolved into digital forms that are now a part of our everyday life due to smartphones, which basically all integrate GIS for localisation and navigation. | ||
| − | + | Geographic Information Systems (GIS), which offer a visual interpretation of data, are mostly focused on mapping. GIS and cartography are being used for an increasing diversity of applications, including integration of Global Positioning System (GPS), remote sensing, global data bases, internet use, web mapping services, and diverse software applications. | |
| − | |||
| − | + | b. Spatial Analysis | |
| − | |||
| − | + | While most GIS applications are related to map making, the term GIS is increasingly being associated with spatial analysis and planning as well. Procedures such as the capturing, visualization, manipulation and analysis of geographic information are continuously evolving within GIS systems. Environmental management and spatial planning are two crucial fields of application for GIS along with agricultural value chain, public health and surveying (Masser and Wegener, 1996). GIS has become a standard tool within spatial planning. A broad variety of pre-programmed tools for spatial analysis are available in modern software solutions, such as ARC/GIS and QGIS. Finer scales are approached by architectural tools such as AutoCAD, and programming languages such as Python and R offer an array of tools for spatial analysis. These tools include network analysis, modelling of digital terrain, and spatial overlay. The ability to modify complex and intricate analysis of sequences using continuously evolving programming languages and data bases has become essential in all components of our daily lives. By linking spatial data to advanced analysis approaches the ability of GIS to allow for future predictions and adaptations has become a breakthrough in modern science. | |
| − | |||
| + | Elements of GIS: | ||
| + | GIS can process both geographic and spatial information at the same time. This requires a variety of functional elements and components. There are five major components including hardware (computer systems, laptops), software (ArcGIS, QGIS, ERDAS etc.), human resources (people with ample knowledge of handling and applying GIS), datasets and analytical methods. | ||
| + | |||
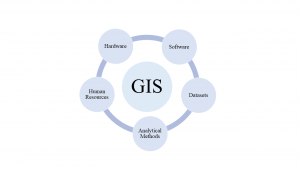
| + | [[File:COmponents GIS.png|thumb|Figure 1: A working integrating GIS five components.]] | ||
| − | + | GIS also includes five major functional or procedural elements for successful operation or application. Those are namely: data acquisition, pre-processing, data management and manipulation, analysis and results generation. | |
| − | |||
| − | + | Data acquisition: It is the process of identifying and gathering new data by preparing maps, aerial photography and surveys. Following table shows few methods of data acquisition: | |
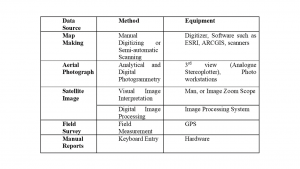
| − | + | [[File:Table 1.png|thumb|Table 1 showing the various data sources and their acquisition methods.]] | |
| + | Preprocessing: It entails changing the data in a variety of ways before entering it into the GIS. Data format conversion and methodically locating objects in the source data are two of the main responsibilities of preprocessing. Extracting data from maps, photos, and printed records (such demographic reports) and then entering it in a computer database are common methods for changing the format of the original data. This process is often time-consuming and expensive exercise. This is especially true when one estimates the costs of moving sizable data volumes from an automated GIS based on computerized databases to paper maps and transparent overlays. | ||
| − | + | Data Management and Manipulation: The development and accession of the database itself are controlled by data-management operations. Data entry, consistent update, deletion, and retrieval are offered by these functions. The users of contemporary database management systems are shielded from the specifics of data storage. Users typically are not aware of well completed data management processes. Security considerations relate to data management. There must be procedures in place to give various users varying levels of access to the system and its database. Data manipulation consists of working with the database contents to derive new information. | |
| − | |||
| − | |||
| − | |||
| + | Analysis: Analysis is often the system user's focus of attention. Many people mistakenly think that this module alone makes up a geographic information system. The analytical operators that use the database contents to generate new information are in this part of the system. We need specific facilities to be able to transfer data and information between systems because one system cannot provide the full range of analytical capabilities a user might conceive. | ||
| − | + | Results Generation: Final outputs from the GIS like statistical reports, maps, and graphics of various kinds are the parts of result generation. | |
| − | GIS | ||
| + | '''Normativity''' | ||
| − | + | • This weakness of data security highlights that GIS information is not only presenting representations of the real world, but also represents generalisations that can be deeply normative. 'Gerrymandering' is an example where the spatial designation of US election districts is clearly altered by politicians to indirectly influence election results. Also, the visual representation of data in maps can be deeply normative, if not manipulative. | |
| − | |||
| − | |||
| − | + | • Hardly any standards of representation of spatial data exist to date. Instead, there are many diverse and more or less aesthetically appealing maps and GIS-derived representations, and the number is growing. This complicates comparability, and increases the risk of falling for manipulative maps. | |
| − | + | • Lastly, as any given empirical data source, a GIS system is only as good as the data that feeds it. Many wrong decisions and imperfection in planning as well as in spatially explicit science were made based on imperfect and limited GIS systems. Despite this known shortcoming, GIS-based analyses are often not amended by a limitation of the given analysis, but are instead simply accepted as is. More critical evaluations are needed to make GIS analysis not only clearly designated in terms of the content, but also the limitations. GIS systems would benefit from such a critical perspective. | |
| + | '''Outlook''' | ||
| + | |||
| + | GIS-based analyses are one of the silent revolutions that came out of the new and interconnected systems that represent our postmodern reality. Spatial data will become even more important in the future, and this demands a pronounced recognition of the responsibility associated with this. There are ample examples how spatial data is used to maximise profit and to use users as a data source. While the technological potential of GIS system will surely increase in the future, the underlying ethical questions and standards will have to be matched to the wealth of data that will become available. It would have been hard to imagine for people twenty years ago how GIS systems are intertwined with our society as well as our realties today. In the next decades, we need to learn more about the possibilities and challenges that may yet arise out of Geographical Information Systems. | ||
| + | |||
| + | '''An exemplary study''' | ||
| + | |||
In their 2015 publication, Partelow et al. (see References) analyzed the extent of pollution exposure on global marine protected areas (MPAs). As a starting point, they characterized protected areas based on five different attributes that they considered critical in defining an MPA's biophysical signature, which were | In their 2015 publication, Partelow et al. (see References) analyzed the extent of pollution exposure on global marine protected areas (MPAs). As a starting point, they characterized protected areas based on five different attributes that they considered critical in defining an MPA's biophysical signature, which were | ||
| − | + | • distance from the shore, | |
| − | + | • amount of biodiversity, | |
| − | + | • bathymetry (= the ocean's depth relative to the sea level), | |
| − | + | • mean surface temperature, and | |
| − | + | • mean sea surface salinity. | |
| − | They projected each attribute as one layer of raster data into the | + | |
| + | They projected each attribute as one layer of raster data into the ArcMAP software, and global marine protected areas as another layer. They selected 2,111 areas that fit their research intent of focusing on conservation, and exported all data into R for statistical analyses. Each MPA was now attributed with data for each of the five categories, based on which a cluster analysis was conducted. This led to the designation of five kinds of groups. | ||
| + | |||
| + | |||
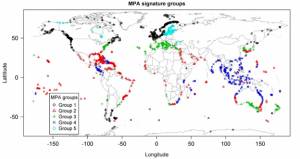
| + | [[File:Picture3.png|thumb|'''This map shows the analyzed MPAs.''' Each color / shape represents one type of marine protected area (MPA) as a result of the cluster analysis based on biophysical characteristics. Source: Partelow et al. 2015, p.354]] | ||
| + | |||
| + | |||
| + | The five groups differ in terms of their biophysical characteristics, which is why the cluster analysis grouped them together. Group 1 is distinctive through lower mean sea surface temperatures and lower biodiversity levels. Group 2 represents MPAs with higher bathymetry and higher shore distances. Group 3 have mid-range biodiversity values and seasonal sea surface temperatures. Group 4 has very high biodiversity values and shallow waters. Group 5 has a significantly lower mean sea surface salinity. | ||
| + | In the next step, the researchers added data on pollution in two forms. Current pollution data was gathered as secondary data from another study, representing current impacts on the MPAs such as shipping traffic frequency, fishing rates, invasive species and others. This data was projected as another raster layer in ArcMAP and attributed to the MPAs in R. Also, future pollution data was added as a layer regarding the impacts of change for UV light on the ocean surface, changes in ocean acidification rates, and sea surface temperature changes. This data was based on changes in these variables until today and was considered representative of which pressure exists on the ecosystems. | ||
| + | |||
| + | [[File:Picture1.png|thumb|'''This map shows the impacts of current pollution on the identified types of MPAs'''. Source: Partelow et al. 2015, p.354]] | ||
| + | |||
| + | [[File:Picture2.png|thumb|'''This map shows the impacts of future pollution on the identified types of MPAs.''' Source: Partelow et al. 2015, p.355]] | ||
| + | |||
| + | Based on their analysis of current and future pollution impacts on the MPAs, the authors concluded that: | ||
| + | |||
| + | • a majority of current MPAs is affected by pollution, | ||
| + | |||
| + | • current pollution is strongest in the global north, while future pollution may impact tropical marine ecosystems more strongly, | ||
| + | |||
| + | • future pollution will on average be higher, and have stronger effects, than current pollution for all MPA groups, and | ||
| + | |||
| + | • an increase in rates of future pollution may be less dependent on the biophysical characteristics of the MPAs than current pollution. | ||
| + | |||
| + | Based on their results, the authors propose diverse recommendations for conservation management. Overall, the study shows how spatial raster data can help assess the state of ecosystems and guide conservation management, both on a global and local scale. | ||
| + | |||
| + | '''Key Publications''' | ||
| + | |||
| + | • Snow, John. 1855. On the mode of communication of cholera. John Churchill. | ||
| − | + | '''References''' | |
| − | + | (1) Partelow, S. von wehrden, H. 2015. Pollution exposure on marine protected areas: A global assessment. Marine Pollution Bulletin 100(1). 352-358. | |
| − | + | Further Information | |
| − | |||
| − | |||
| − | |||
| − | |||
| − | |||
| − | |||
| − | |||
| − | |||
| − | |||
| − | |||
| − | + | • [http://apogeospatial.com/the-enduring-legacy-of-howard-fisher/ Some information] on the importance of Howard T. Fisher's work for GIS. | |
| − | + | • A QGIS overview on [https://docs.qgis.org/2.8/en/docs/gentle_gis_introduction/vector_data.html vector data] and [https://docs.qgis.org/2.8/en/docs/gentle_gis_introduction/raster_data.html raster data]. | |
| − | |||
| + | • Another overview of raster and vector data by [https://gisgeography.com/spatial-data-types-vector-raster/ gisgeography.com]. | ||
| − | |||
| − | |||
| − | |||
| − | |||
| − | |||
| − | |||
| − | |||
| − | |||
| − | |||
| − | |||
| − | |||
| − | |||
| − | |||
| − | |||
| − | The | + | The authors of this article are [https://www.leuphana.de/institute/institut-fuer-oekologie/personen/henrik-von-wehrden.html Prof. Henrik von Wehrden] and [https://www.leuphana.de/en/institutes/institute-of-ecology/team/neha-chauhan.html Neha Chauhan]. |
Latest revision as of 14:25, 26 July 2024
Quantitative - Qualitative
Deductive - Inductive
Individual - System - Global
Past - Present - Future
In short: Geographical information systems (GIS) subsume all approaches that serve as a data platform and analysis tools for spatial data.
Background
While Geographical Information Systems are typically associated with digital systems, the systematic creation of knowledge through the analysis of spatial data can be dated back long before the invention of modern computers. The first spatial analysis was focussed on the spread of Cholera in Paris (1832, "Rapport sur la marche et les effets du choléra dans Paris et le département de la Seine. Année 1832") and London (1854). While the map of Paris showed Cholera cases on a scale of the districts, John Snow showed in London the cases of citizens that died of Cholera as dots. This allowed for a clear representation of the spread of the disease. Since cases were clustered around a well, John Snow could infer that the water sources is the main spread vector of the disease. This is insofar remarkable, as is clearly highlights how knowledge could be derived inductively without any understanding of the deeper mechanics of Cholera, or let alone even the knowledge of bacteria.
At this time, topographic maps were already perfected as part of the Nation States creating inventories and understandings of their territories, and also of their colonies and their wealth. Topographic maps were increasingly able to depict different layers of information, as maps were printed in different colours that all represented different kinds of information, such as vegetation, thematic information, water, and more. With the rise of the computer age, this information was implemented into computers, and Canada created the first digital Geographical Information System in the 1960. This highlights how innovation of Geographical Information Systems was strongly driven by application, since such systems are of direct benefit in planning and governance. The main driver of innovation in early GIS development was however Howard T. Fisher from Harvard, who - with his team - developed important cornerstones that still serve as a basis for GIS, including different data formats and the general architecture of GIS systems. First commercial systems started to thrive in the 1970s and 1980s, yet only with the rise of personal computers and the Internet, Geographical Information Systems unleashed their full potential.
While simple vector formats were already widely used in the 1990s and even before, the development of a faster bandwidth and computer power proved essential to foster the exchange and usage of satellite data. While much of this data (NOAA, LANDSAT) can be traced back to the 1970s, it was the computer age that made this data widely available to the common user. Thanks to the 'Freedom of Information Act', much of the US-based data was quickly becoming available to the whole world, for instance through the University of Maryland and the NASA. The development of GPS systems that originated in military systems allowed for a solution to spatial referencing and location across the whole globe. Today, commercial units from around the millennium are implemented in almost every smartphone in a much smaller version. This wide establishment allows for the location of not only our technical gadgets, but also goods and transportation machines. An initial NASA system showed a strong resemblance to Google Earth in the early 2000s, and with the commercial launch of Google Earth and Google Maps, the tech giant built a spatial database that is to date almost unrivalled.
With the Smartphone age, this information became rapidly available to the wider public, and ever more complex growing databases and apps are today adding millions of spatial entries to the global databases. The early and often clumsy GIS software suits are more diversified and broadly available today, making GIS systems a common staple of many branches of science. Open street map data and QGIS prove that data and software solutions are possible beyond the commercial business sector. Geographical Information Systems, and with them geospatial data and complex analysis, have become one of the main branches of the Internet and indeed the Modern Age. Augmented Reality and self-driving cars showcase the potential of this technology for the future, but the potentially constant geotagging of all citizens that own a smartphone also highlights problems of data security and globalisation.
What is GIS?
With the rise of computers the processing, usage and analysis of spatial data has been playing a key role across all facets of our societies. Within science, diverse fields such as geography, spatial science, data science and many other fields have harnessed the use of information technology to access information sources and to integrate the processing, analysis and interpretation of spatial data. This development continuously unleashed new potential in how we observe, communicate, and evaluate the spatial patterns, processes and mechanisms that utilize but equally drive the internet and computerization. Within geographical information systems, a generalisation of the world is saved within diverse data formats, ultimately deriving a coarse version that represents the respective spatial phenomena. Geographical information systems -or short GIS- are computer systems for managing, analysing, and displaying data related to positions and geographic information. GIS can show many kinds of data on one map. A GIS facilitates diverse ways to visualize, analyse, and understand spatial patterns and processes. Since much of the data we utilize can be spatially referenced by a coordinate system, GIS data can be facilitated to analyse such spatially referenced information. For example, if we want to know about the number of students participating in different lectures taking place at Leuphana, a simple table cross-referenced with the respective lecture halls might suffice. Yet in order to enable a spatial representation of the location the students within those lecture halls, a geographical visualization is required. Illustration of this example?
There are diverse definitions available for geographic information system, e.g.
“GIS is an integrated system of computer hardware, software, and trained personnel linking topographic, demographic, utility, facility, image and other resource data that is geographically referenced. -------NASA
“In the strictest sense, a GIS is a computer system capable of assembling, storing, manipulating, and displaying geographically referenced information, i.e. data identified according to their locations. Practitioners also regard the total GIS as including operating personnel and the data that go into the system.” -------USGS
“A geographic information system (GIS) is a computer-based tool for mapping and analysing things that exist and events that happen on earth. GIS technology integrates common database operations such as query and statistical analysis with the unique visualization and geographic analysis benefits offered by maps.” -------ESRI
Examples of Applications of GIS:
GIS operate on various levels and typically serve multiple functions. The most basic level to operate GIS is cartography, which is commonly used to map making. GIS can also be used for spatial data analysis.
a. GIS Cartography Maps are an integral part of human development, and many cultures have utilized maps as crucial tools to navigate, explore, describe and explain. Early maps were essentially an attempt on story telling of distant voyages by cartographers. Cartographers performed the role of artists by creating images based on traveller knowledge, memories, and concerns. With the rise of mathematics, particularly trigonometrics, and the development of technology, maps evolved into digital forms that are now a part of our everyday life due to smartphones, which basically all integrate GIS for localisation and navigation.
Geographic Information Systems (GIS), which offer a visual interpretation of data, are mostly focused on mapping. GIS and cartography are being used for an increasing diversity of applications, including integration of Global Positioning System (GPS), remote sensing, global data bases, internet use, web mapping services, and diverse software applications.
b. Spatial Analysis
While most GIS applications are related to map making, the term GIS is increasingly being associated with spatial analysis and planning as well. Procedures such as the capturing, visualization, manipulation and analysis of geographic information are continuously evolving within GIS systems. Environmental management and spatial planning are two crucial fields of application for GIS along with agricultural value chain, public health and surveying (Masser and Wegener, 1996). GIS has become a standard tool within spatial planning. A broad variety of pre-programmed tools for spatial analysis are available in modern software solutions, such as ARC/GIS and QGIS. Finer scales are approached by architectural tools such as AutoCAD, and programming languages such as Python and R offer an array of tools for spatial analysis. These tools include network analysis, modelling of digital terrain, and spatial overlay. The ability to modify complex and intricate analysis of sequences using continuously evolving programming languages and data bases has become essential in all components of our daily lives. By linking spatial data to advanced analysis approaches the ability of GIS to allow for future predictions and adaptations has become a breakthrough in modern science.
Elements of GIS: GIS can process both geographic and spatial information at the same time. This requires a variety of functional elements and components. There are five major components including hardware (computer systems, laptops), software (ArcGIS, QGIS, ERDAS etc.), human resources (people with ample knowledge of handling and applying GIS), datasets and analytical methods.
GIS also includes five major functional or procedural elements for successful operation or application. Those are namely: data acquisition, pre-processing, data management and manipulation, analysis and results generation.
Data acquisition: It is the process of identifying and gathering new data by preparing maps, aerial photography and surveys. Following table shows few methods of data acquisition:
Preprocessing: It entails changing the data in a variety of ways before entering it into the GIS. Data format conversion and methodically locating objects in the source data are two of the main responsibilities of preprocessing. Extracting data from maps, photos, and printed records (such demographic reports) and then entering it in a computer database are common methods for changing the format of the original data. This process is often time-consuming and expensive exercise. This is especially true when one estimates the costs of moving sizable data volumes from an automated GIS based on computerized databases to paper maps and transparent overlays.
Data Management and Manipulation: The development and accession of the database itself are controlled by data-management operations. Data entry, consistent update, deletion, and retrieval are offered by these functions. The users of contemporary database management systems are shielded from the specifics of data storage. Users typically are not aware of well completed data management processes. Security considerations relate to data management. There must be procedures in place to give various users varying levels of access to the system and its database. Data manipulation consists of working with the database contents to derive new information.
Analysis: Analysis is often the system user's focus of attention. Many people mistakenly think that this module alone makes up a geographic information system. The analytical operators that use the database contents to generate new information are in this part of the system. We need specific facilities to be able to transfer data and information between systems because one system cannot provide the full range of analytical capabilities a user might conceive.
Results Generation: Final outputs from the GIS like statistical reports, maps, and graphics of various kinds are the parts of result generation.
Normativity
• This weakness of data security highlights that GIS information is not only presenting representations of the real world, but also represents generalisations that can be deeply normative. 'Gerrymandering' is an example where the spatial designation of US election districts is clearly altered by politicians to indirectly influence election results. Also, the visual representation of data in maps can be deeply normative, if not manipulative.
• Hardly any standards of representation of spatial data exist to date. Instead, there are many diverse and more or less aesthetically appealing maps and GIS-derived representations, and the number is growing. This complicates comparability, and increases the risk of falling for manipulative maps.
• Lastly, as any given empirical data source, a GIS system is only as good as the data that feeds it. Many wrong decisions and imperfection in planning as well as in spatially explicit science were made based on imperfect and limited GIS systems. Despite this known shortcoming, GIS-based analyses are often not amended by a limitation of the given analysis, but are instead simply accepted as is. More critical evaluations are needed to make GIS analysis not only clearly designated in terms of the content, but also the limitations. GIS systems would benefit from such a critical perspective.
Outlook
GIS-based analyses are one of the silent revolutions that came out of the new and interconnected systems that represent our postmodern reality. Spatial data will become even more important in the future, and this demands a pronounced recognition of the responsibility associated with this. There are ample examples how spatial data is used to maximise profit and to use users as a data source. While the technological potential of GIS system will surely increase in the future, the underlying ethical questions and standards will have to be matched to the wealth of data that will become available. It would have been hard to imagine for people twenty years ago how GIS systems are intertwined with our society as well as our realties today. In the next decades, we need to learn more about the possibilities and challenges that may yet arise out of Geographical Information Systems.
An exemplary study
In their 2015 publication, Partelow et al. (see References) analyzed the extent of pollution exposure on global marine protected areas (MPAs). As a starting point, they characterized protected areas based on five different attributes that they considered critical in defining an MPA's biophysical signature, which were • distance from the shore, • amount of biodiversity, • bathymetry (= the ocean's depth relative to the sea level), • mean surface temperature, and • mean sea surface salinity.
They projected each attribute as one layer of raster data into the ArcMAP software, and global marine protected areas as another layer. They selected 2,111 areas that fit their research intent of focusing on conservation, and exported all data into R for statistical analyses. Each MPA was now attributed with data for each of the five categories, based on which a cluster analysis was conducted. This led to the designation of five kinds of groups.
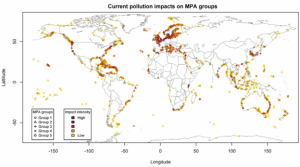
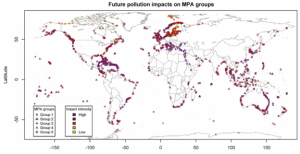
The five groups differ in terms of their biophysical characteristics, which is why the cluster analysis grouped them together. Group 1 is distinctive through lower mean sea surface temperatures and lower biodiversity levels. Group 2 represents MPAs with higher bathymetry and higher shore distances. Group 3 have mid-range biodiversity values and seasonal sea surface temperatures. Group 4 has very high biodiversity values and shallow waters. Group 5 has a significantly lower mean sea surface salinity.
In the next step, the researchers added data on pollution in two forms. Current pollution data was gathered as secondary data from another study, representing current impacts on the MPAs such as shipping traffic frequency, fishing rates, invasive species and others. This data was projected as another raster layer in ArcMAP and attributed to the MPAs in R. Also, future pollution data was added as a layer regarding the impacts of change for UV light on the ocean surface, changes in ocean acidification rates, and sea surface temperature changes. This data was based on changes in these variables until today and was considered representative of which pressure exists on the ecosystems.
Based on their analysis of current and future pollution impacts on the MPAs, the authors concluded that:
• a majority of current MPAs is affected by pollution,
• current pollution is strongest in the global north, while future pollution may impact tropical marine ecosystems more strongly,
• future pollution will on average be higher, and have stronger effects, than current pollution for all MPA groups, and
• an increase in rates of future pollution may be less dependent on the biophysical characteristics of the MPAs than current pollution.
Based on their results, the authors propose diverse recommendations for conservation management. Overall, the study shows how spatial raster data can help assess the state of ecosystems and guide conservation management, both on a global and local scale.
Key Publications
• Snow, John. 1855. On the mode of communication of cholera. John Churchill.
References
(1) Partelow, S. von wehrden, H. 2015. Pollution exposure on marine protected areas: A global assessment. Marine Pollution Bulletin 100(1). 352-358.
Further Information
• Some information on the importance of Howard T. Fisher's work for GIS.
• A QGIS overview on vector data and raster data.
• Another overview of raster and vector data by gisgeography.com.
The authors of this article are Prof. Henrik von Wehrden and Neha Chauhan.
