Difference between revisions of "Group Concept Mapping"
| (One intermediate revision by one other user not shown) | |||
| Line 1: | Line 1: | ||
| − | [[File: | + | [[File:Quan qual indu syst pres.png|thumb|right|[[Design Criteria of Methods|Method Categorisation:]]<br> |
| − | + | '''Quantitative''' - '''Qualitative'''<br> | |
| − | <br | + | Deductive - '''Inductive'''<br> |
| − | + | Individual - '''System''' - Global<br> | |
| − | + | Past - '''Present''' - Future]] | |
| − | |||
| − | |||
| − | |||
| − | |||
| − | |||
| − | |||
| − | |||
| − | |||
| − | |||
| − | |||
| − | |||
'''In short:''' Group Concept Mapping is a participatory mixed-methods approach to generate, structure and visualise conceptual information. | '''In short:''' Group Concept Mapping is a participatory mixed-methods approach to generate, structure and visualise conceptual information. | ||
== Background == | == Background == | ||
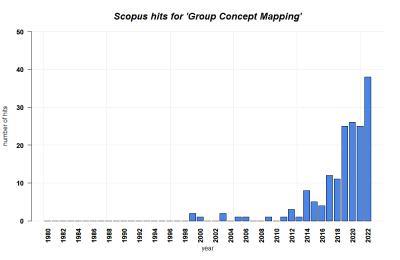
| + | [[File:Group Concept Mapping scopus plot.png|400px|thumb|right|'''SCOPUS hits per year for Group Concept Mapping until 2022.''' Search term: 'Group Concept Mapping' in Title, Abstract, Keywords. Source: own.]] | ||
The general idea of Concept Mapping was developed by Joseph Novak and colleagues at Cornell University in the 1970s (Brown). The idea was to structure and visualize knowledge about a topic in an educational context. Concept Mapping is typically still used in education until today. '''In 1989, William M.K. Trochim, also from Cornell University, expanded on this idea and introduced Group Concept Mapping''' as a structured methodological approach (Trochim 1989). He originally presented it as a way to create conceptual frameworks for planning and evaluation purposes. At the same time, the results of a Group Concept Mapping process provide insights into specific topics that are of strong interest to scientific research, which is why the method may be seen by some researchers as both a research method and a planning and evaluation tool (cf. Dare & Nowicki 2019, p.3). Thematically, the method can find application in any field and is '''often used in health and social work''' (see for example McCaffrey et al. 2019, Trochim et al. 1994, Trochim et al. 2003) | The general idea of Concept Mapping was developed by Joseph Novak and colleagues at Cornell University in the 1970s (Brown). The idea was to structure and visualize knowledge about a topic in an educational context. Concept Mapping is typically still used in education until today. '''In 1989, William M.K. Trochim, also from Cornell University, expanded on this idea and introduced Group Concept Mapping''' as a structured methodological approach (Trochim 1989). He originally presented it as a way to create conceptual frameworks for planning and evaluation purposes. At the same time, the results of a Group Concept Mapping process provide insights into specific topics that are of strong interest to scientific research, which is why the method may be seen by some researchers as both a research method and a planning and evaluation tool (cf. Dare & Nowicki 2019, p.3). Thematically, the method can find application in any field and is '''often used in health and social work''' (see for example McCaffrey et al. 2019, Trochim et al. 1994, Trochim et al. 2003) | ||
Latest revision as of 13:25, 12 March 2024
Quantitative - Qualitative
Deductive - Inductive
Individual - System - Global
Past - Present - Future
In short: Group Concept Mapping is a participatory mixed-methods approach to generate, structure and visualise conceptual information.
Contents
Background
The general idea of Concept Mapping was developed by Joseph Novak and colleagues at Cornell University in the 1970s (Brown). The idea was to structure and visualize knowledge about a topic in an educational context. Concept Mapping is typically still used in education until today. In 1989, William M.K. Trochim, also from Cornell University, expanded on this idea and introduced Group Concept Mapping as a structured methodological approach (Trochim 1989). He originally presented it as a way to create conceptual frameworks for planning and evaluation purposes. At the same time, the results of a Group Concept Mapping process provide insights into specific topics that are of strong interest to scientific research, which is why the method may be seen by some researchers as both a research method and a planning and evaluation tool (cf. Dare & Nowicki 2019, p.3). Thematically, the method can find application in any field and is often used in health and social work (see for example McCaffrey et al. 2019, Trochim et al. 1994, Trochim et al. 2003)
What the method does
Group Concept Mapping is a structured, linear group-based approach of gathering conceptual elements, arranging and rating them, and creating visual representations. The end result is typically a map or similar form of visual representation, which displays the ideas and how they relate to each other. This visualisation, as suggested by Trochim 1989, can serve as a baseline for a subsequent planning or evaluation process. An important feature is the focus on the group of actors who create the concept map on their own, supported by the methodological process and a facilitator. The end result is based on their own contributions, represents their own understanding of the issue at hand, and can thus more easily be used by them for the following processes.
Differences to Concept Mapping and Mindmaps
Concept Maps refer to visual representations of conceptual ideas, as introduced by Novak and colleagues in the 1970s (Trochim 1989). Information (words or short sentences) is put into boxes or circles, which are connected in a network-like structure through arrows. This is in a way comparable to a mindmap. However, Mindmaps do not serve the purpose of presenting a final, comprehensive overview over a specific focus on a topic, but rather an unstructured, spontaneous collection of general related ideas around one key term. Both processes - Concept Maps and Mindmaps - can be done by a single person or in a group. For example, Brown (2003) shows how group-based creation of a concept map can enhance biology teaching.
By comparison, Group Concept Mapping is not a mere group-based creation of a Concept Map, but an established methodological approach which includes qualitative and quantitative elements, and can be seen as a mixed methods approach in itself, with both elements of data gathering and analysis. It is a structured form of framework development, in which ideas, thoughts, goals, needs and resources relevant to a specific topic are collected, conceptually linked, quantitatively evaluated and presented in a map-like visualisation.
The process of Group Concept Mapping
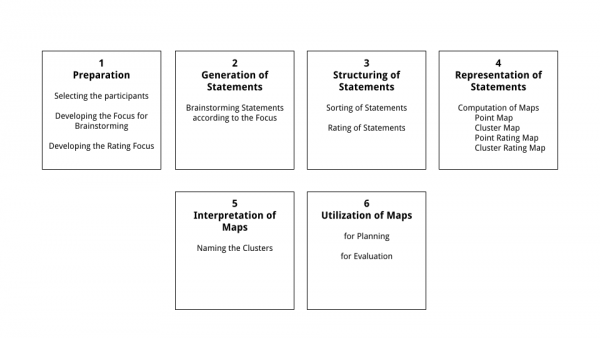
Group Concept Mapping typically consists of six linear steps (see figure): Preparation, Statement Generation, Structuring, Representation, Interpretation, Utilization. Below, we will elaborate on each step based on the original methodological design by Trochim (1989), and present the process as done in the exemplary study by McCaffrey et al. (2019), who attempted to generate a conceptual model of good health care from the perspective of patients.
1 - Preparation
a) Selecting the participants
In the preparation phase, first, the group of actors is gathered that will contribute to the process. The individuals are selected by the facilitator, who can be a member of the relevant group itself, or an outsider. The selected group, "[d]epending on the situation, (...) might consist of the administrators, staff or members of the board of an organization; community leaders (...); academicians or members of the policy making community; (...) representatives of relevant client populations" or other individuals that are relevant to the topic at hand, and whose perspectives should be included in the resulting framework visualisation (Trochim 1989, 2). When selecting the participants, "[b]road heterogeneous participation helps to insure that a wide variety of viewpoints will be considered and encourages a broader range of people to "buy into" the conceptual framework which results". (Trochim 1989, 3). Individuals may be selected by hand, or by the use of stratified or purposive sampling. Trochim (1989) recommends a group to include 10-20 individuals, but larger or smaller groups are still imaginable. Further, it is possible for the group size to vary in the different steps of the process, whereas continuity along all steps of the process might support a better understanding of the result for all participants (Trochim 1989).
b) Developing the Focus for Brainstorming
In the second part of the preparation, the underlying "rules" of the process are constituted. This involves, first, the creation of clearly defined, mutually agreed-upon prompts or questions which define the thematical focus of the latter brainstorming (in Step 2). The brainstorming might be intended to revolve around goals, outcomes, involved individuals or activities, problems, or other conceptual elements, and so the prompts or questions should target these. Whatever the group decides to focus on, the sentences or questions resulting from this first step should clearly define which kind of ideas and elements are gathered later, and every involved participant should agree on them.
c) Developing the Focus for Rating
Additionally, but not necessarily, a rating scheme can be developed. For this, the group decides on dimensions along which the collected ideas and elements from the brainstorming will be rated (in Step 3). This rating can revolve around the statements' importance, complexity, likeliness or such, and the group decides which kind of scale will be used to rate these elements. (Trochim 1989). For example, if we take the question of reasons for students to enroll, it could be reasonable to rate these reasons according to their importance on a 1-5 Likert Scale. As a second example, it could be interesting to rate how easy or likely the problems of the youth in the neighborhood might be to solve.
Our example
In our exemplary study, McCaffrey et al. developed three focus prompts based on previous insights from Interviews:
- Please give us statements that describe 'good health care'.
- What does 'good health care' look like?
- Think about the health care that you have received. What aspects of your care have you liked?
As a rating scheme, the researchers later asked participants to rate the items generated as answers to these prompts by importance.
In terms of partipants, the researchers recruited individuals from two groups through an online health research network of 600,000 members: 157 patients with six different health conditions, as well as 17 health stakeholders (six patient representatives, six health providers, one researcher, two purchaser groups, two individuals from measure development).
2 - Generation of statements
Now, the recruited group brainstorms all elements (= "statements") that come to mind in accordance with the pre-defined brainstorming focus prompt or question. So if the group defined to focus on goals of their organization, they should collect whichever potential, desirable, or current goals come to mind. None of these ideas are rated or discussed at this point. The process can be done anonymously if necessary, digitally as well as analogously. Trochim (1989) recommends to limit the brainstorming outcome to ~100 terms. If more terms arise, it might be necessary to reduce this number by deleting synonyms, or (jointly) grouping terms. Generally, the responses should be edited for clarity, and irrelevant responses should be deleted (Dare & Nowicki 2019). In the end, all participants should be informed and on the same page regarding all mentioned items. It is worthwhile mentioning that sometimes, the brainstorming phase is not necessary, and the elements can be derived from the prevalent organizational structure, existing documents, or other sources (Trochim 1989).
Our example
McCaffrey et al. provided the selected individuals digitally with the three focus prompts, and obtained 1564 statements in response. Further, they conducted a literature review on patient health care priorities, from which they extracted further 146 statements; and further 69 statements from Interviews that were done in preparation to their study. The researchers reduced this pool of almost 2000 statements through an iterative coding and cleaning process to a final selection of 79 statements.
3 - Structuring of Statements
a) Sorting of Statements
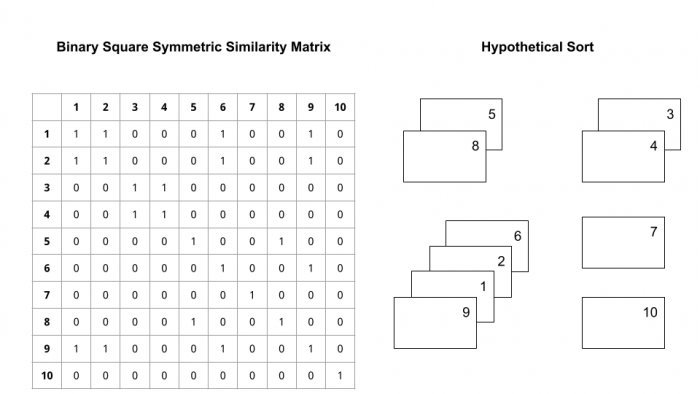
The generated statements are now structured in relation to each other. In the original proposition by Trochim (1989), this is done by writing down each statement individually onto cards, and providing these cards to each participant. They are then asked to group statements onto piles as they consider reasonable. After everyone did so, a matrix is created in which for every combination of two statements, a "1" indicates that these two statements were grouped together by a participant, while a "0" indicates that they were not (see figure). Next, all matrices are combined into one so that the number in each field represents how many participants combined a given pair of statements. This way, it can be identified which similitude or relationship the group assigns to the gathered statements. Today, this process can still be done manually, but is more commonly conducted digitally, for example with the groupwisdom™ software (see Further Links)
b) Rating of Statements
Secondly, every participant is asked to rate each statement on the pre-defined rating dimensions. This is typically be done using a 1-5 or 1-7 Likert Scale. The means are calculated and assigned to the statements.
Our example
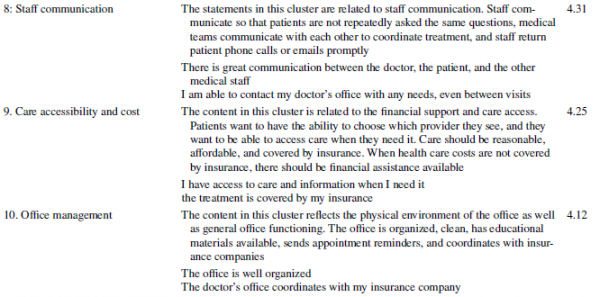
McCaffrey et al. recruited new participants for this step in accordance with the diversity criteria for Step 1, including members of the previously used health network, local community members, and health stakeholders. Overall, they obtained 123, 27 and 15 complete sorting and rating results, respectively. They used the CSGlobal MAX software, which is a precursor to groupwisdom™, and asked their participants to rate the 79 previously gathered items on a scale from 1 (Not Important) to 5 (Extremely Important).
4 - Representation of Statements
At this point, the group has created a set of max. 100 statements which describe a specific topic (e.g. goals of their organization), and a matrix exists that highlights both the relationship between these statements and each statement's rating in regard to a specific rating focus.
Point Map
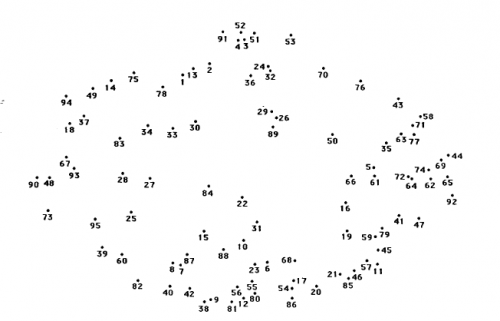
Now, each statement is placed on a blank, typically two-dimensional map, with more closely related statements being placed more closely to each other. This is done using multidimensional scaling (MDS), a multivariate statistical approach, which accomplishes the complex task of placing all data points in the relative distance to all other data points, as defined by the values of relatedness indicated in the matrix.
An exemplary Point Map of 95 statements from Trochim 1989, p.11. Each point represents a statement that was gathered by the group, and is placed in a way that represents relatedness to the other statements.
Cluster Map
In a second step, all statements (= data points) are grouped into clusters "which represent higher order conceptual groupings of the original set of statements." (Trochim 1989). This is done - as proposed by Trochim (1989) - by using the X-Y coordinates of each statement after the multidimensional scaling as input for a Ward's hierarchical cluster analysis (HCA), which "partitions the multidimensional scaling map into any number of clusters" (Trochim 1989, 8). The analyst has to decide how many clusters the statements should be grouped into, based on what makes sense with regards to the topic and statements. You will find more on cluster analysis in this entry.
Concerning the software for the conduction of this clustering, Dare & Nowicki (2019, p.9) highlight that multidimensional scaling as well as hierarchical cluster analysis can be performed using statistical software such as R, SAS, or SPSS, or with the aforementioned groupwisdom© software.
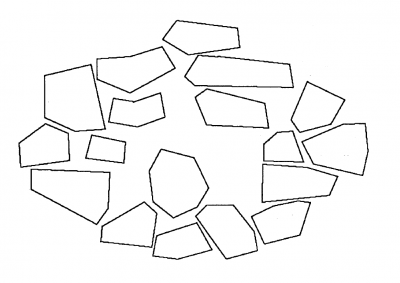
The Cluster Map, which puts the statements (data points) into groups by means of Cluster Analysis. The visual representation of these clusters is in shapes instead of points. The amount of clusters is adjustable based on what makes sense for the data. Each cluster will be given a sensible name by the group (Step 5). Source: adapted from Trochim 1989, p.12
Rating Maps
At the end of this step, the group has a (two-dimensional) map that includes all statements as data points, placed according to their relatedness (the "Point Map"); and one map that also groups these data points into clusters (the "Cluster Map"). Two more maps can be created based on these. The ratings that were assigned to each statement in the matrix in Step 3 are placed in the respective position on the map, resulting in the "Point Rating Map". The same is done for each cluster, with the Point Ratings being averaged within each cluster.
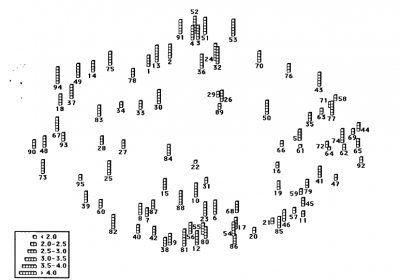
The respective Point Rating Map. For each data point, the mean rating as assigned by the group in Phase 3 is indicated, based on a 1-5 Likert Scale in this case. Source: Trochim 1989, p.13
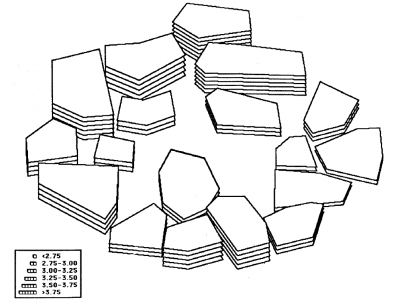
And finally, the (still unlabeled) Cluster Rating Map. Here, the point ratings of all data points (on a 1-5 Likert Scale) within each cluster are averaged, leading to a rating for each cluster, indicated by the "levels". With this map at hand, it is easy to see which groups of ideas, problems, goals, or individuals are most "important", "difficult", or "likely" for the group, which is of great help for their planning or evaluation process. Source: adapted from Trochim 1989, p.14
Our example
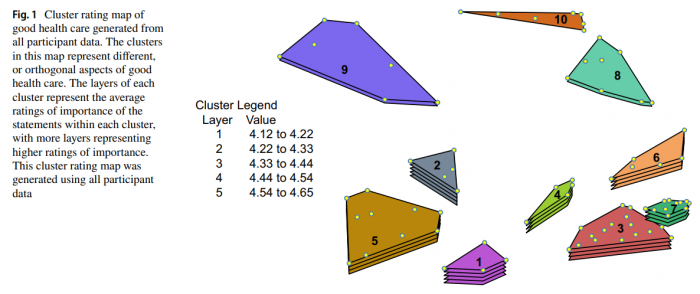
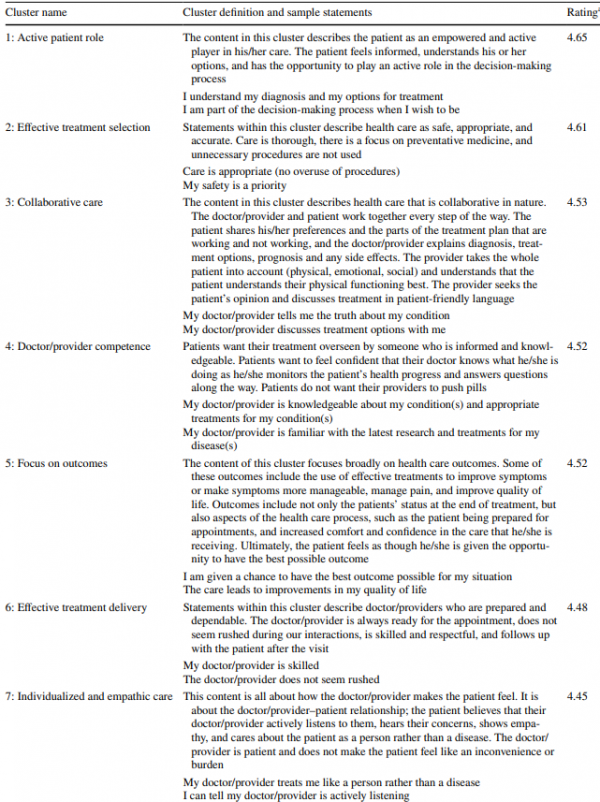
McCaffrey et al. first considered the three participant groups' responses individually to see if there were diverging conceptual understandings of what constitutes good health care, but eventually combined their results into one conceptual model. They created a point maps, and evaluated different numbers of clusters before eventually deciding on a 10-cluster result, with which they developed a cluster map. Each cluster represented a different aspect of good health care. They calculated ratings for all data points and clusters and created point and cluster rating maps, where a higher rating equals a more important aspect of good health care. They found that there are only small differences in their highest and lowest rated clusters, which they stated highlights that the initial selection of statements already included very important aspects of good health care. They further investigated if there were significant differences between different participant groups' clustering results, which they did not find.
5 - Interpretation of Maps
Now, the group is asked to assign names to the clusters. Each participants looks at each cluster and the statements included, and suggests a name (e.g. a phrase, or a word) to describe the cluster, and the group negotiates until consensus is reached for each cluster. If there are a lot of clusters, it may be sensible to further develop names for groups of clusters - "regions" - but this depends on the map at hand. In any case, the names of the clusters should represent the statements included as well as the conceptual relation to other clusters which are close. This labeled Cluster Map is the main outcome of the Group Concept Mapping process. It can be re-arranged by the group if necessary, since they should feel comfortable with the conceptual framework it represents.
In the end of the process, the group has the following results:
- a statement list
- a point map
- a point rating map
- a cluster list (listing all labeled clusters including the respective statements)
- a labeled cluster map,
- and a labeled cluster rating map.
Our example
McCaffrey et al. named the clusters themselves, based on "cluster names provided by participants whose
sorting produced results similar to the final cluster content, and (2) by reviewing statements within each cluster" (p.89).
The final list of clusters in McCaffrey et al. (2019, p.90f) The clusters (left) are presented in order of importance (right), with a description and exemplary statements for each cluster in the center.
6 - Utilization of Maps
The group is now done with the Group Concept Mapping process, and can use either of the maps (preferable the Cluster Map, or Cluster Rating Map) as a baseline for their further work in many diverse ways. The maps show the most important elements they need to pay attention to, which can be used to coordinate future actions, prioritize tasks, and structure the process. The clusters can serve as the organizational foundation, or as groups of topics to work on, either when implementing measures, or developing an evaluation scheme.
Our example
For example, the results of the study by McCaffrey et al. (2019) may be of value for health care providers to evaluate and improve their services, and for health researchers to identify relevant aspects for further investigation.
Strengths & Challenges
- Group Concept Mapping is a systematic and highly structured process with clear procedural steps, that helps a diverse group of people gather and structure their thoughts into a coherent and consensual set of maps.
- The process of Group Concept Mapping is empowering: all content that is included in, and leads to the final maps is created by the group itself, in their own language and based on their own perspectives. The participants will feel more ownership for the conceptual framework that results from the process, and the framework is more likely to be actively used by all involved actors than a framework that is imposed without involvement.
- The end result of the process is a visual representation which introduces all important ideas at a glance in a structured manner. The maps can be easily communicated and presented without any knowledge about the methodological process.
- Group Concept Mapping is versatile in that it can work with all kinds of statements, gathered from workshop sessions as presented above, or from documents, organisational structures etc. As Jackson and Trochim (2002) present, it can also be a useful approach to analyze open-ended survey responses, which are transformed into single statements and sorted by the researchers. Then, they can be analyzed using the multidimensional scaling and cluster analysis steps as presented above.
- A challenge lies in the organisation of the process. For example, the number and selection of participants will influence the outcome and must therefore be done carefully. Further, the number of statements that are gathered, the way they are reduced if necessary, as well as the number of clusters are in the hands of the researchers. These decisions shape the end results and require thoughtful consideration of the topic and data at hand.
Normativity
- Group Concept Mapping may be of interest in application-oriented research and transdisciplinary research. It allows for non-scientific actors to contribute their perspectives, actively engage with an issue and (research) question, and it empowers them to approach the problem with the self-developed conceptual framework.
- The method is an interesting mix of qualitative research, akin to workshop-based or interview-like research approaches; and quantitative multivariate statistical analysis. Therefore, this single methodological process is a mixed methods approach in itself, highlighting the power of a sensible combination of diverse methods.
- To assess the reliability and consistency of the process, Trochim et al. (1994) suggest using the contingency coefficient for all pairs of sorts from the matrix (Step 3). This way, it can be analyzed how the individual participants' sorts are interrelated, and if they sorted consistently. They further propose to split the group and correlate the resulting matrices and the results of the multi-dimensional scaling.
- As McCaffrey et al. (2019) highlight, the results of Group Concept Mapping are mostly based on self-reported perception, which might differ from external analyses of the issue at hand. In their case, it was insightful to learn about patients' perspective on good health care, but medical reports offer another valuable perspective that should be taken into account.
Outlook
Methodologically, Group Concept Mapping has been established for decades, and although elements of the process have found re-iterations and diversification, the general process seems unlikely to change drastically. However, as more transdisciplinary and practice-oriented research, as well as mixed methods approaches, take place, one can assume that Group Concept Mapping may find more diverse and frequent application in different fields of research in the future.
Key Publications
Trochim, W.M.K. 1989. AN INTRODUCTION TO CONCEPT MAPPING FOR PLANNING AND EVALUATION. Evaluation and Program Planning 12. 1-16.
Kane, M., & Trochim, W. M. K. (2007). Concept mapping for planning and evaluation. Sage Publications, Inc.
References
(1) Trochim, W.M.K. 1989. AN INTRODUCTION TO CONCEPT MAPPING FOR PLANNING AND EVALUATION. Evaluation and Program Planning 12. 1-16.
(2) McCaffrey, S.A. Chiauzzi, E. Chan, C. Hoole, M. 2019. Understanding 'Good Health care' from the Patient's Perspective: Development of a Conceptual Model Using Group Concept Mapping. The Patient - Patient-Centered Outcomes Research 12. 83-95.
(3) Brown, D.S. 2003. High School Biology: A Group Approach to Concept Mapping. The American Biology Teacher 65.3. 192-197.
(4) Jackson, K.M. Trochim, W.M.K. 2002. Concept Mapping as an Alternative Approach for the Analysis of Open-Ended Survey Responses. Organizational Research Methods 5(4). 307-336.
(5) Dare, L. Nowicki, E. 2019. Engaging Children and Youth in Research and Evaluation using Group Concept Mapping. Evaluation and Program Planning 76.
(6) Trochim, W.M.K. Cook, J.A. Setze, R.J. 1994. Using Concept Mapping to Develop a Conceptual Framework of Staff's Views of a Supported Employment Program for Individuals With Severe Mental Illness. Journal of Consulting and Clinical Psychology 62(4). 766-775.
(7) Trochim, W.M.K. Milsein, B. Wood, B.J. Jackson, S. Pressler, V. 2003. Setting Objectives for Community and Systems Change: An Application of Concept Mapping for Planning a Statewide Health Improvement Initiative. Health Promotion Practice. 1-12.
Further Links
- billtrochim.net - Bill Trochim's own overview website on the method.
- groupwisdom™, which is an official software for the conduction of Group Concept Mapping processes [1](https://groupwisdom.com/buy)
The author of this entry is Christopher Franz.
