Difference between revisions of "Graphic Recording"
| (36 intermediate revisions by 3 users not shown) | |||
| Line 1: | Line 1: | ||
| + | {|class="wikitable" style="text-align: center; width: 100%" | ||
| + | ! colspan = "4" | Type !! colspan = "4" | Team Size | ||
| + | |- | ||
| + | |'''[[:Category:Me, Myself and I|Me, Myself and I]]''' || '''[[:Category:Group Collaboration|Group Collaboration]]''' || [[:Category:The Academic System|The Academic System]] || [[:Category:Software|Software]] || '''[[:Category:Team Size 1|1]]''' || '''[[:Category:Team Size 2-10|2-10]]''' || [[:Category:Team Size 11-30|11-30]] || [[:Category:Team Size 30+|30+]] | ||
| + | |} | ||
| + | |||
== What, Why & When == | == What, Why & When == | ||
| − | Ever lost the golden thread in listening to a lengthy talk or | + | Ever lost the golden thread in listening to a lengthy talk or very abstract discussion? <br> |
| − | Visualizations help! <br> | + | '''[[Glossary|Visualizations]] help!''' <br> |
| − | |||
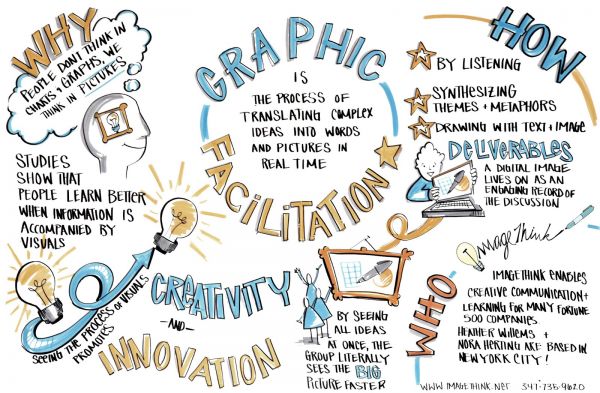
| − | == | + | Graphic Recording is the process of LIVE translating complex ideas from a spoken event into drawn words and pictures. It is used in meetings, discussions, talks and conferences to help participants engage with, comprehend and remember the contents better by making them graphically visible. |
| + | |||
| + | [[File:Graphic Recording 2.jpg|600px|thumb|center|'''Graphic Recording helps visualise complex ideas.''' Source: [http://theasideblog.blogspot.com/2012/05/imagethink-graphic-facilitation-big.html The Aside Blog, ImageThink]]] | ||
| + | |||
| + | == Goals == | ||
* ENGAGE - get people to think creatively about what they hear | * ENGAGE - get people to think creatively about what they hear | ||
* COMPREHEND - illustrate complexity and interconnections for better comprehension | * COMPREHEND - illustrate complexity and interconnections for better comprehension | ||
* REMEMBER - people remember visuals more easily than words | * REMEMBER - people remember visuals more easily than words | ||
| + | |||
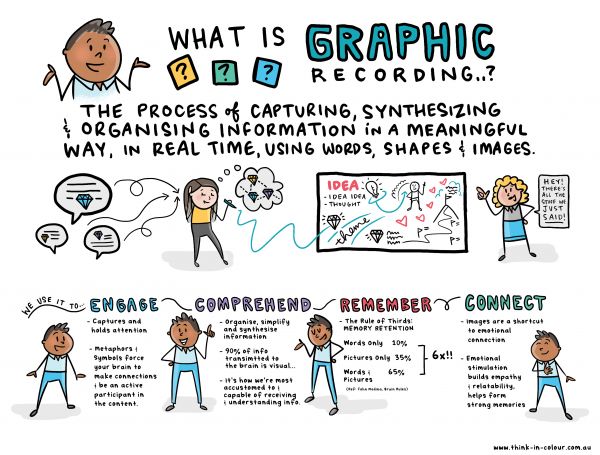
| + | [[File:Graphic Recording.jpg|600px|thumb|center|'''Graphic Recording: How To''' Source: [https://www.think-in-colour.com.au/wp-content/uploads/2012/05/00_WHat-is-Graphic-Recording_2019.jpg Think in Colour]]] | ||
== Getting started == | == Getting started == | ||
| − | + | ==== What you need ==== | |
| − | + | '''Graphic library'''<br> | |
| − | + | Your graphic library is your mental (and paper) collection of visuals and drawing ideas that you tap on when you do a live recording. While some visuals are easily imagined, more complex and abstract ideas need some reimagination. Get to know the key words for your recording session and find visuals beforehand. That way, you feel more confident in drawing when contents get difficult.<br> | |
| − | |||
| − | + | '''Recording station'''<br> | |
| − | + | The graphic facilitator is usually placed somewhere to the side where she is visible to the audience but not distracting. Graphics can be drawn on boards, paper, flipchart etc. There are very good (and very expensive) special markers for graphic facilitation. Test which ones flow easily and suit your drawing style and technique.<br> | |
| − | |||
| − | + | '''Courage to draw''' (because everyone CAN do it!) ...<br> | |
| − | + | The most important thing you need is courage to draw in front of others. The good thing is, that you don't need to be an artist, because graphic facilitation focuses on structuring content rather than artistic aesthetics. However, practice boosts confidence!<br> | |
| + | ''... or you hire a professional graphic facilitator for your event'' | ||
| − | + | ==== How to start ==== | |
| + | '''Practice essentials'''<br> | ||
| + | Asking Mike Rohde (2012) the Essential Eight are: lines, bullets, boxes, arrows, lettering, people, colors, and shade. | ||
| + | ''(insert pictures here)''<br> | ||
| − | + | '''Use sketchnotes'''<br> | |
| + | Try taking notes from your classes, seminars, lectures, or use TED talks to practice your visualization skills. Sketchnotes are essentially the private form of a graphic recording in your own notebook. It's the ideal (because purposeful) way to experiment and build your graphic library. | ||
| − | Anna Lena Schiller (2017): Graphic Recording: Live Illustrations for Meetings, Conferences and Workshops<br> | + | == Links & Further reading == |
| − | + | * Learning Graphic Facilitation part I: https://www.youtube.com/watch?v=S5DJC6LaOCI<br> | |
| − | Martin Haussmann (2014): UZMO: Denken mit dem Stift<br> | + | * Learning Graphic Facilitation part II: https://www.youtube.com/watch?v=H0QZbwqp4lg<br> |
| − | + | * Mike Rohde (2012): The Sketchnote Handbook https://rohdesign.com/<br> | |
| − | Bikablo (visual libraries) | + | * Anna Lena Schiller (2017): Graphic Recording: Live Illustrations for Meetings, Conferences and Workshops<br> |
| + | * Martin Haussmann (2014): UZMO: Denken mit dem Stift<br> | ||
| + | * Bikablo (visual libraries) https://bikablo.com/en/ | ||
---- | ---- | ||
__NOTOC__ | __NOTOC__ | ||
| − | [[Category: | + | [[Category:Hacks, Habits & Tools]] |
| + | [[Category:Me, Myself and I]] | ||
| + | [[Category:Group Collaboration]] | ||
| + | [[Category:Team Size 1]] | ||
| + | |||
| + | The [[Table_of_Contributors| author]] of this entry is Dagmar Mölleken. | ||
Latest revision as of 14:10, 2 April 2024
| Type | Team Size | ||||||
|---|---|---|---|---|---|---|---|
| Me, Myself and I | Group Collaboration | The Academic System | Software | 1 | 2-10 | 11-30 | 30+ |
What, Why & When
Ever lost the golden thread in listening to a lengthy talk or very abstract discussion?
Visualizations help!
Graphic Recording is the process of LIVE translating complex ideas from a spoken event into drawn words and pictures. It is used in meetings, discussions, talks and conferences to help participants engage with, comprehend and remember the contents better by making them graphically visible.

Goals
- ENGAGE - get people to think creatively about what they hear
- COMPREHEND - illustrate complexity and interconnections for better comprehension
- REMEMBER - people remember visuals more easily than words

Getting started
What you need
Graphic library
Your graphic library is your mental (and paper) collection of visuals and drawing ideas that you tap on when you do a live recording. While some visuals are easily imagined, more complex and abstract ideas need some reimagination. Get to know the key words for your recording session and find visuals beforehand. That way, you feel more confident in drawing when contents get difficult.
Recording station
The graphic facilitator is usually placed somewhere to the side where she is visible to the audience but not distracting. Graphics can be drawn on boards, paper, flipchart etc. There are very good (and very expensive) special markers for graphic facilitation. Test which ones flow easily and suit your drawing style and technique.
Courage to draw (because everyone CAN do it!) ...
The most important thing you need is courage to draw in front of others. The good thing is, that you don't need to be an artist, because graphic facilitation focuses on structuring content rather than artistic aesthetics. However, practice boosts confidence!
... or you hire a professional graphic facilitator for your event
How to start
Practice essentials
Asking Mike Rohde (2012) the Essential Eight are: lines, bullets, boxes, arrows, lettering, people, colors, and shade.
(insert pictures here)
Use sketchnotes
Try taking notes from your classes, seminars, lectures, or use TED talks to practice your visualization skills. Sketchnotes are essentially the private form of a graphic recording in your own notebook. It's the ideal (because purposeful) way to experiment and build your graphic library.
Links & Further reading
- Learning Graphic Facilitation part I: https://www.youtube.com/watch?v=S5DJC6LaOCI
- Learning Graphic Facilitation part II: https://www.youtube.com/watch?v=H0QZbwqp4lg
- Mike Rohde (2012): The Sketchnote Handbook https://rohdesign.com/
- Anna Lena Schiller (2017): Graphic Recording: Live Illustrations for Meetings, Conferences and Workshops
- Martin Haussmann (2014): UZMO: Denken mit dem Stift
- Bikablo (visual libraries) https://bikablo.com/en/
The author of this entry is Dagmar Mölleken.