Difference between revisions of "Mindmap"
| Line 2: | Line 2: | ||
! colspan = "4" | Type !! colspan = "4" | Team Size | ! colspan = "4" | Type !! colspan = "4" | Team Size | ||
|- | |- | ||
| − | | '''[[:Category: | + | |'''[[:Category:Me, Myself and I|Me, Myself and I]]''' || [[:Category:Group Collaboration|Group Collaboration]] || [[:Category:The Academic System|The Academic System]] || [[:Category:Software|Software]] || '''[[:Category:Team Size 1|1]]''' || '''[[:Category:Team Size 2-10|2-10]]''' || [[:Category:Team Size 11-30|11-30]] || [[:Category:Team Size 30+|30+]] |
|} | |} | ||
| Line 32: | Line 32: | ||
---- | ---- | ||
__NOTOC__ | __NOTOC__ | ||
| − | [[Category: | + | [[Category:Hacks, Habits & Tools]] |
| − | + | [[Category:Me, Myself and I]] | |
| − | [[Category: | ||
[[Category:Team Size 1]] | [[Category:Team Size 1]] | ||
| − | |||
The [[Table_of_Contributors| author]] of this entry is Christopher Franz. | The [[Table_of_Contributors| author]] of this entry is Christopher Franz. | ||
Latest revision as of 13:59, 2 April 2024
| Type | Team Size | ||||||
|---|---|---|---|---|---|---|---|
| Me, Myself and I | Group Collaboration | The Academic System | Software | 1 | 2-10 | 11-30 | 30+ |
What, Why & When
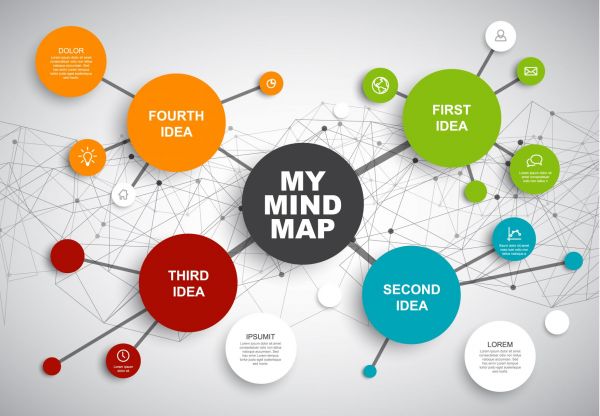
Mindmapping is a tool for the visual organisation of information, showing ideas, words, names and more in relation to a central topic and to each other. The focus is on structuring information in a way that provides a good overview of a topic and supports communication and creativity.
Goals
- Visualise information in an intuitive structure for a good overview of key elements of a topic.
- Better communicate and structure information for individual and team work.
Getting started
Although this claim is not fully supported by research, the underlying idea of a Mindmap is to mimick the way the brain structures information by creating a map of words, hence the name. Yet indeed, research has indicated that this approach to structuring information is an efficient way of memorizing and understanding information. The Mindmap was created and propagated in the 1970s by Tony Buzan.

A Mindmap enables the visual arrangement of various types of information, including tasks, key concepts, important topics, names and more. It allows for a quick overview of all relevant information items on a topic at a glance. It helps keeping track of important elements of a topic, and may support communication of information to other people, for example in meetings. A Mindmap can also be a good tool for a brainstorming process, since it does not focus too much on the exact relationships between the visualised elements, but revolves around a more intuitive approach of arranging information.
The central topic is written into the center of the visualisation (e.g. a whiteboard, with a digital tool, or a large horizontally arranged sheet of paper). This central topic can be see as a city center on a city map, and all relevant information items then are arranged around it like different districts of the city. The information items should focus on the most important terms and data, and omit any unncessary details. These elements may be connected to the central topic through lines, like streets, or branches, resulting in a web structure. Elements may be subordinate to other elements, indicating nestedness of the information. Colors, symbols and images may be used to further structure the differences and similaritiess between different areas of the map, and the length thickness of the connections may be varied to indicate the importance of connections.
Links & Further reading
Sources:
- MindMapping.com - Was ist eine Mindmap?]
- Tony Buzan. 2006. MIND MAPPING. KICK-START YOUR CREATIVITY AND TRANSFORM YOUR LIFE. Buzan Bites. Pearson Education.
- Uni Köln Methodenpool - Mind-Mapping]
- Kreativitätstechniken.info - Mindmapping]
- Lifehack - How to Mind Map to Visualize Ideas (With Mind Map Examples)]
- The Tutor Team. MIND MAPS: HOW THEY CAN HELP YOUR CHILD ACHIEVE]
The author of this entry is Christopher Franz.