File:Introduction to Statistical Figures - Venn Diagram example.png
From Sustainability Methods
No higher resolution available.
Introduction_to_Statistical_Figures_-_Venn_Diagram_example.png (738 × 459 pixels, file size: 73 KB, MIME type: image/png)
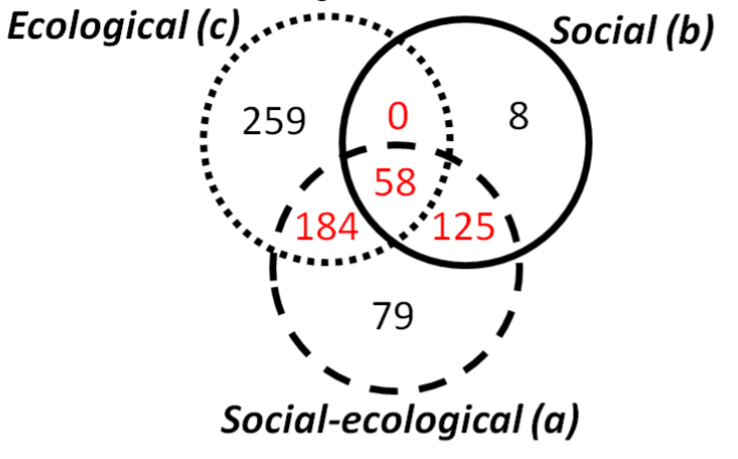
A Venn Diagram showing the number of articles in a systematic review that revolve around one or more of three topics. Source: Partelow et al. 2018. A Sustainability Agenda for Tropical Marine Science.
File history
Click on a date/time to view the file as it appeared at that time.
| Date/Time | Thumbnail | Dimensions | User | Comment | |
|---|---|---|---|---|---|
| current | 09:01, 20 May 2021 | | 738 × 459 (73 KB) | Christopher Franz (talk | contribs) |
- You cannot overwrite this file.
File usage
The following page uses this file: