File:Introduction to Statistical Figures - Circular Network Plots.png
From Sustainability Methods
Size of this preview: 694 × 600 pixels. Other resolutions: 278 × 240 pixels | 760 × 657 pixels.
Original file (760 × 657 pixels, file size: 515 KB, MIME type: image/png)
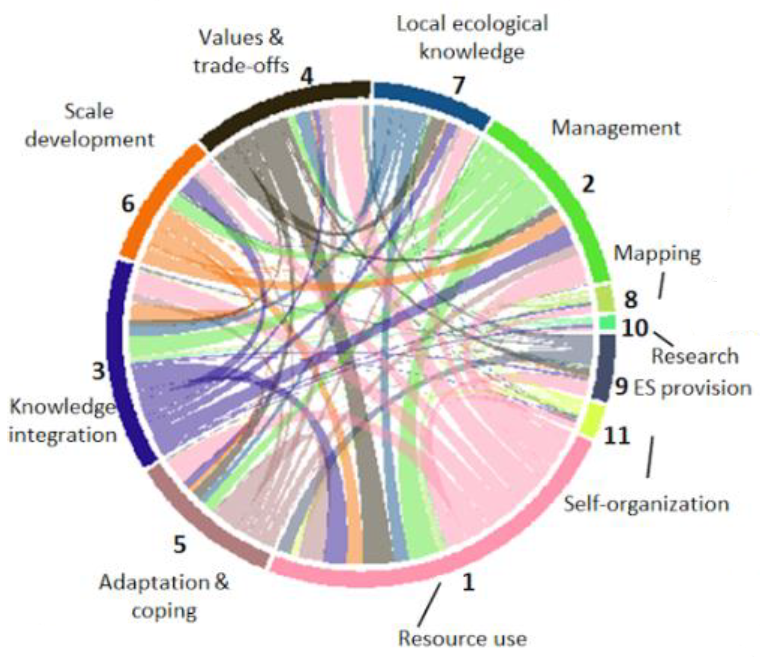
A circular network plot showing how sub-topics of social-ecological processes were represented in articles assessed in a systematic review. The proportion of the circle represents a topic's importance in the research, and the connections show if topics were covered alongside each other. Source: Partelow et al. 2018. A sustainability agenda for tropical marine science.
File history
Click on a date/time to view the file as it appeared at that time.
| Date/Time | Thumbnail | Dimensions | User | Comment | |
|---|---|---|---|---|---|
| current | 09:32, 20 May 2021 | | 760 × 657 (515 KB) | Christopher Franz (talk | contribs) |
- You cannot overwrite this file.
File usage
The following page uses this file: