File:Statistics flowchart - Categorical factor levels.png
From Sustainability Methods
No higher resolution available.
Statistics_flowchart_-_Categorical_factor_levels.png (647 × 473 pixels, file size: 108 KB, MIME type: image/png)
Summary
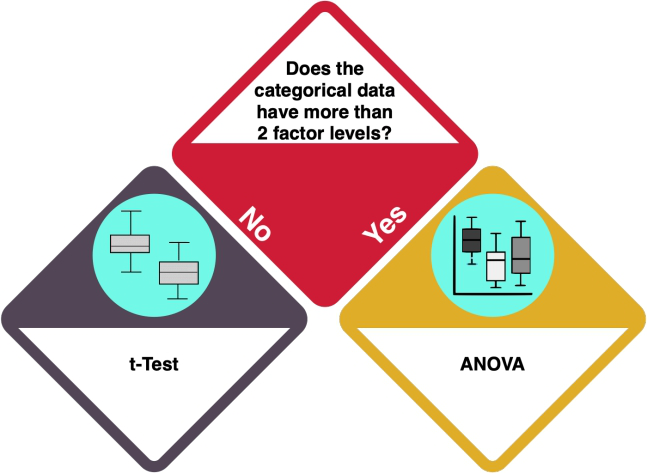
Statistics Flowchart - Categorical factor levels
File history
Click on a date/time to view the file as it appeared at that time.
| Date/Time | Thumbnail | Dimensions | User | Comment | |
|---|---|---|---|---|---|
| current | 13:55, 26 May 2021 | | 647 × 473 (108 KB) | Christopher Franz (talk | contribs) | |
| 08:06, 23 March 2021 | 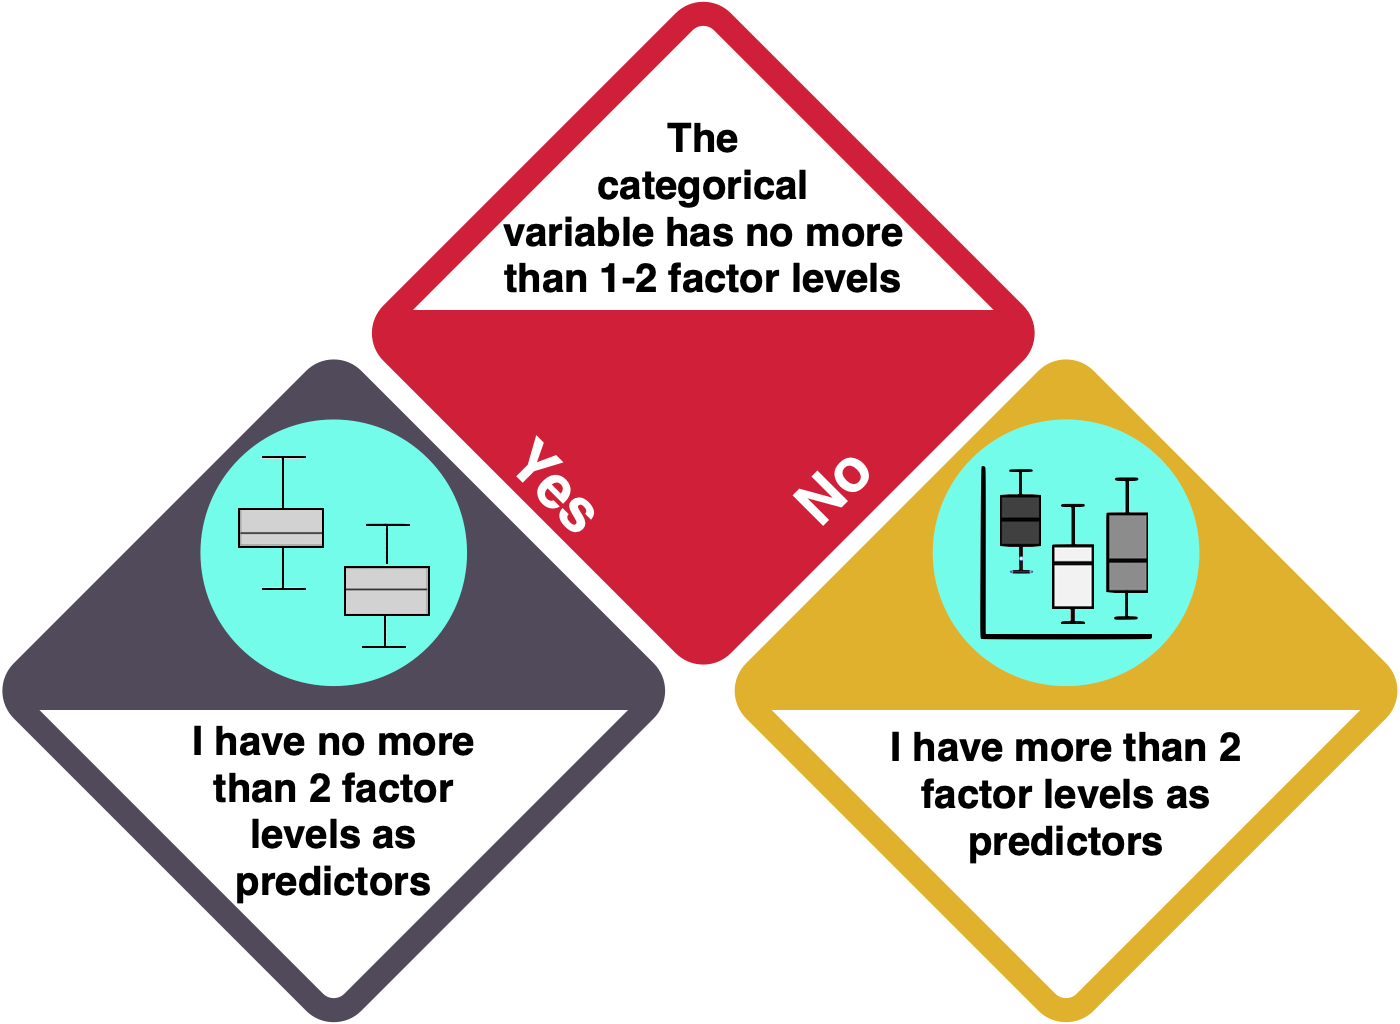 | 1,400 × 1,024 (110 KB) | Christopher Franz (talk | contribs) | Statistics Flowchart - Categorical factor levels |
- You cannot overwrite this file.
File usage
The following page uses this file: